
Pepe rally gains traction amid rebound from short-term overbought signals

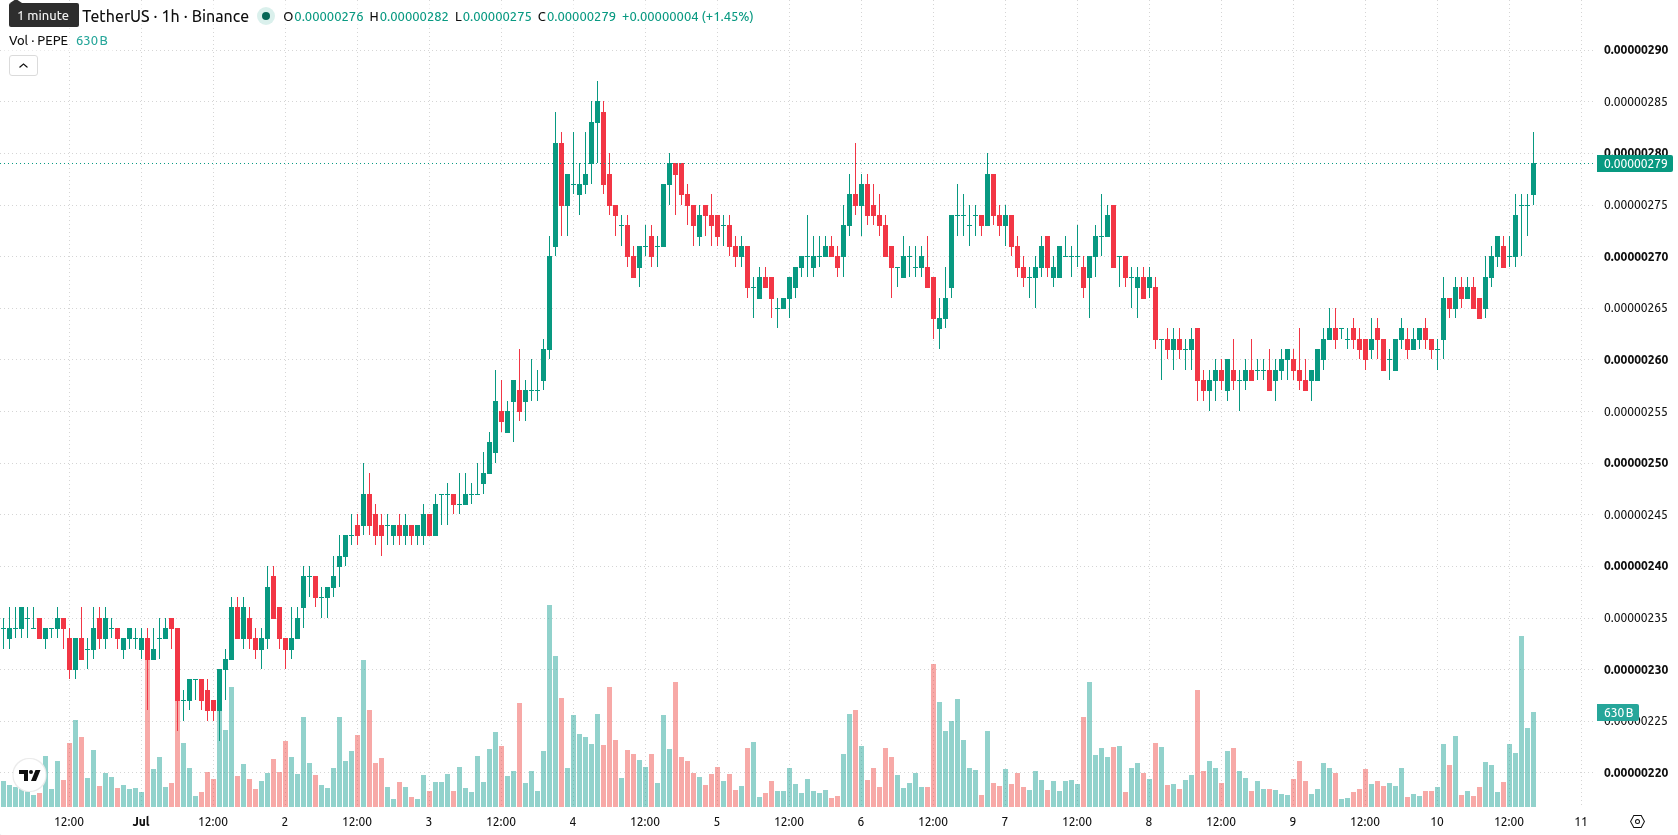
Pepe (PEPE) is trading at $0.0000028, up 8.49% for the day. The price is currently positioned above its key moving averages, reflecting strong upward momentum in the short term.
 0.0529
0.052870
0.0529
0.052870
Highlights
- PEPE/USD displays short- and medium-term bullish momentum, having moved above key moving averages despite long-term bearish pressure.
- Momentum indicators, including MACD and ADX, signal ongoing buying interest, but oscillators warn of overbought conditions and a possible divergence.
- Price is forecasted to trade between $0.000002728 and $0.00000296 over the next 2–3 sessions with very high probability of further gains.
Momentum divergence as oscillators clash with trend indicators
On the technical side, PEPE/USD is above both the MA-20 ($0.00000267) and MA-50 ($0.000002629), while remaining below the longer term MA-200 ($0.000003844). The Ichimoku Kijun at $0.00000267 is acting as immediate price support. Momentum indicators such as the Moving Average Convergence Divergence (MACD) and Average Directional Index (ADX) both indicate buying momentum. The Relative Strength Index (RSI) stands at 62.95, signaling a buying bias, while the Commodity Channel Index (CCI) highlights an overbought state. Stochastic RSI identifies strong selling pressure, but Bull/Bear Power signals ongoing buyer dominance. The Awesome Oscillator confirms alignment with the overall upward trend. This blend of indicator readings shows a divergence between short-term oscillator signals and overall buying momentum.
Upside bias as resistance break outweighs limited downside risks
Looking ahead to the next two to three trading days, PEPE/USD is forecast to trade between $0.000002728 and $0.00000296. There is a very high probability of an upward move, while downside risk appears to be very low. If price consolidates, a sideways trajectory within this range is likely. A bullish scenario would see the pair break resistance toward the upper end of the range, while a bearish scenario may emerge only if price falls below the immediate support at $0.00000267.
Previously, analysts noted that Pepe was experiencing persistent bearish pressure with a likelihood of sideways price consolidation. The current upward momentum, marked by the price moving above key short-term averages, introduces a new bullish dimension, making a break above recent resistance a potential catalyst for further gains in the immediate term.









-
 Afghanistan
-
 Albania
-
 Algeria
-
 Angola
-
 Argentina
-
 Armenia
-
 Australia
-
 Austria
-
 Azerbaijan
-
 Bahamas
-
 Bahrain
-
 Bangladesh
-
 Belarus
-
 Belgium
-
 Bolivia
-
 Botswana
-
 Brazil
-
 Brunei
-
 Bulgaria
-
 Cambodia
-
 Cameroon
-
 Canada
-
 Chile
Chile
-
 China
China
-
 Colombia
-
 Congo
Congo
-
 Costa Rica
-
 Cote d'Ivoire
-
 Croatia
-
 Cuba
Cuba
-
 Cyprus
-
 Czechia
-
 DR Congo
-
 Denmark
-
 Dominican Republic
-
 Ecuador
-
 Egypt
Egypt
-
 El Salvador
-
 Estonia
-
 Eswatini
-
 Ethiopia
-
 Finland
-
 France
-
 Georgia
-
 Germany
-
 Ghana
Ghana
-
 Greece
-
 Haiti
Haiti
-
 Hong Kong
-
 Hungary
-
 India
India
-
 Indonesia
-
 Iran, Islamic republic
-
 Iraq
Iraq
-
 Ireland
-
 Israel
-
 Italy
Italy
-
 Jamaica
-
 Japan
Japan
-
 Jordan
-
 Kazakhstan
-
 Kenya
Kenya
-
 Korea
Korea
-
 Kuwait
-
 Kyrgyzstan
-
 Laos
Laos
-
 Latvia
-
 Lebanon
-
 Lesotho
-
 Libya
Libya
-
 Lithuania
-
 Luxembourg
-
 Madagascar
-
 Malaysia
-
 Malta
Malta
-
 Mauritius
-
 Mexico
-
 Moldova
-
 Mongolia
-
 Montenegro
-
 Morocco
-
 Mozambique
-
 Myanmar
-
 Namibia
-
 Nepal
Nepal
-
 Netherlands
-
 New Zealand
-
 Nigeria
-
 North Macedonia
-
 Norway
-
 Oman
Oman
-
 Pakistan
-
 Palestine
-
 Panama
-
 Papua New Guinea
-
 Paraguay
-
 Peru
Peru
-
 Philippines
-
 Poland
-
 Portugal
-
 Puerto Rico
-
 Qatar
Qatar
-
 Reunion
-
 Romania
-
 Rwanda
-
 Saudi Arabia
-
 Serbia
-
 Singapore
-
 Slovakia
-
 Slovenia
-
 Somalia
-
 South Africa
-
 Spain
Spain
-
 Sri Lanka
-
 Sweden
-
 Switzerland
-
 Syria
Syria
-
 Taiwan
-
 Tajikistan
-
 Tanzania
-
 Thailand
-
 Trinidad and Tobago
-
 Tunisia
-
 Turkey
-
 UAE
UAE
-
 Uganda
-
 Ukraine
-
 United Kingdom
-
United States
-
 Uruguay
-
 Uzbekistan
-
 Venezuela
-
 Vietnam
-
 Yemen
Yemen
-
 Zambia
-
 Zimbabwe
- Forex
- Crypto











