
BNB holds steady above MA-200 supported by new inclusion in S&P Pantera Index: weekly report

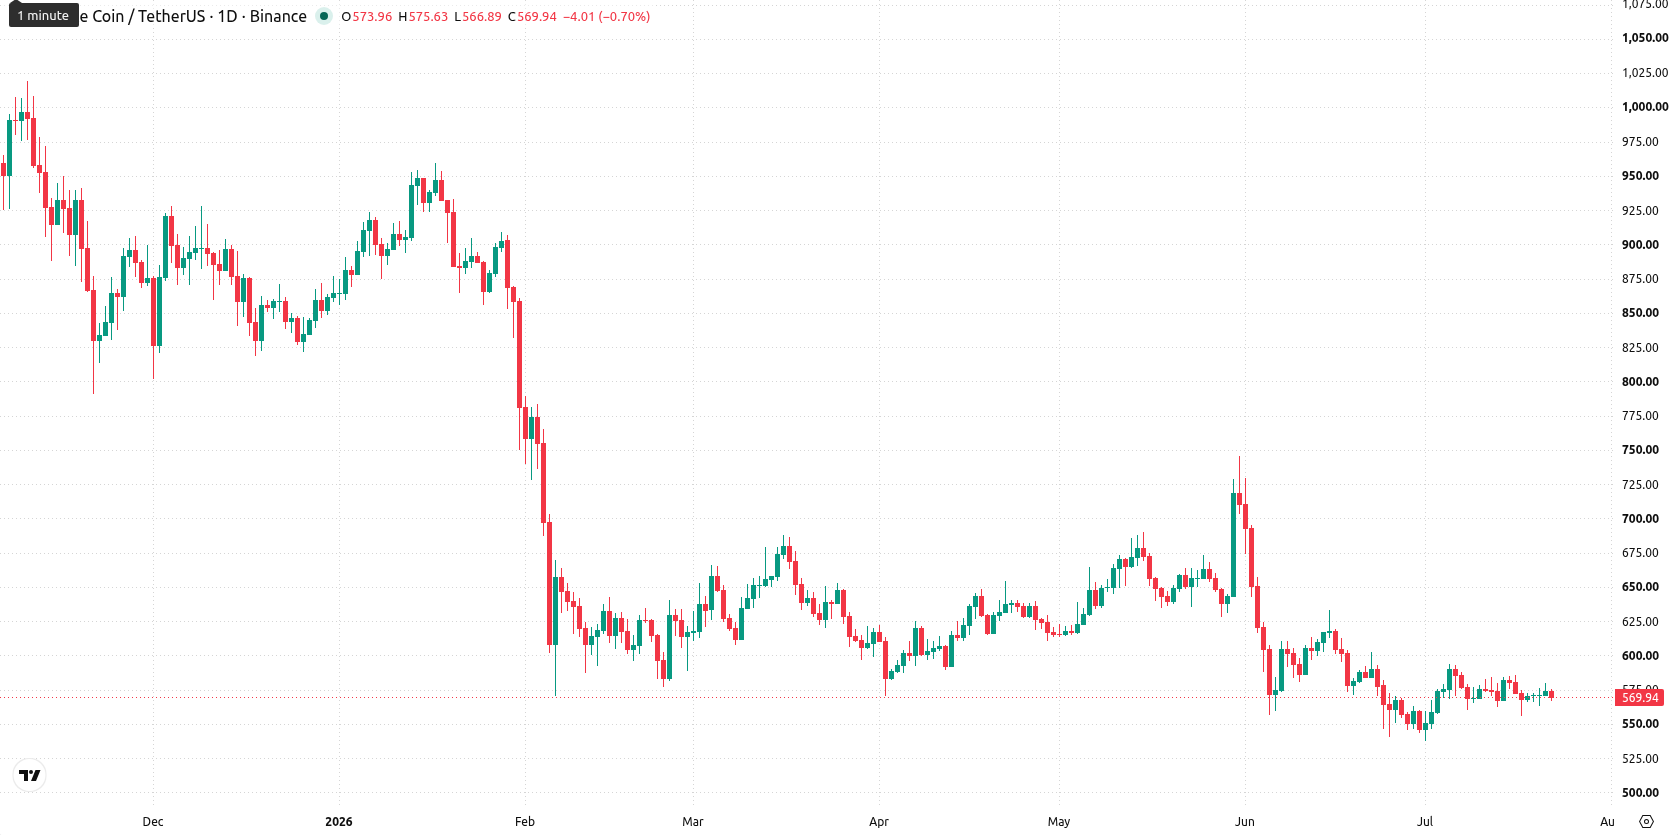
Binance Coin (BNB) is currently trading at $569.90, positioning it below its weekly MA-20 at $615.65 and MA-50 at $782.79, but holding above the MA-200 at $531.62. Over the past week, BNB has declined by $8.08, a movement of 1.40%, with the price now situated in the middle of its recent weekly range.
 569.11
577.20
569.11
577.20
Highlights
- BNB faces sustained medium-term selling pressure, trading below key moving averages but holding above longer-term support.
- Momentum indicators and oscillators confirm a bearish outlook, reflecting persistent seller dominance and oversold conditions without signs of reversal.
- BNB is expected to remain range-bound between $541 and $599 for the week, with a drop below $541 risking further declines.
Index inclusion bolsters sentiment as BNB gains recognition
Binance Coin has been included as one of the top five components in the new S&P Pantera Digital Asset Index, developed by S&P Dow Jones Indices and Pantera Capital. The index focuses on digital assets with significant revenue and real-world utility, and explicitly names BNB among its main constituents, alongside Ethereum, Solana, TRON, and Hyperliquid. Recent coverage also continues to highlight BNB's established role as a utility-driven asset in the crypto sector.
Bearish technical signals deepen as momentum weakens during the week
Weekly technical momentum for BNB remains bearish, as the MACD issues a strong sell signal and the ADX reveals a lack of trend strength. The RSI (W1) stands at 40.14, suggesting a continued selling bias, while Stochastic RSI and CCI signal oversold levels and Bull/Bear Power confirms seller dominance. The price sits between weekly support at $541 and resistance near the MA-20 at $599 — the latter acting as dynamic resistance for the week.
Range-bound forecast as bearish momentum limits upside next week
Based on weekly chart indicators, BNB is expected to trade within a range of $541 to $599 over the next 7 days, reflecting ongoing sideways and slightly negative momentum. All four major weekly signals remain bearish, with less than a 20% chance of a price increase; a continued slow decline is therefore favored. Should the price break above $599, a short-term rebound could develop, while a move below $541 may open the path toward the MA-200 and an increased risk of further losses.
Previously it was reported that Binance Coin’s price action was driven by a balance of near-term technical strength and underlying longer-term pressures. Recent developments—such as BNB’s inclusion in the S&P Pantera Digital Asset Index—add a new dimension, suggesting that investors should now monitor whether index-driven demand can offset prevailing bearish momentum, particularly as BNB trades between key technical thresholds.


Latest BNB News







-
 Afghanistan
-
 Albania
-
 Algeria
-
 Angola
-
 Argentina
-
 Armenia
-
 Australia
-
 Austria
-
 Azerbaijan
-
 Bahamas
-
 Bahrain
-
 Bangladesh
-
 Belarus
-
 Belgium
-
 Bolivia
-
 Botswana
-
 Brazil
-
 Brunei
-
 Bulgaria
-
 Cambodia
-
 Cameroon
-
 Canada
-
 Chile
Chile
-
 China
China
-
 Colombia
-
 Congo
Congo
-
 Costa Rica
-
 Cote d'Ivoire
-
 Croatia
-
 Cuba
Cuba
-
 Cyprus
-
 Czechia
-
 DR Congo
-
 Denmark
-
 Dominican Republic
-
 Ecuador
-
 Egypt
Egypt
-
 El Salvador
-
 Estonia
-
 Eswatini
-
 Ethiopia
-
 Finland
-
 France
-
 Georgia
-
 Germany
-
 Ghana
Ghana
-
 Greece
-
 Haiti
Haiti
-
 Hong Kong
-
 Hungary
-
 India
India
-
 Indonesia
-
 Iran, Islamic republic
-
 Iraq
Iraq
-
 Ireland
-
 Israel
-
 Italy
Italy
-
 Jamaica
-
 Japan
Japan
-
 Jordan
-
 Kazakhstan
-
 Kenya
Kenya
-
 Korea
Korea
-
 Kuwait
-
 Kyrgyzstan
-
 Laos
Laos
-
 Latvia
-
 Lebanon
-
 Lesotho
-
 Libya
Libya
-
 Lithuania
-
 Luxembourg
-
 Madagascar
-
 Malaysia
-
 Malta
Malta
-
 Mauritius
-
 Mexico
-
 Moldova
-
 Mongolia
-
 Montenegro
-
 Morocco
-
 Mozambique
-
 Myanmar
-
 Namibia
-
 Nepal
Nepal
-
 Netherlands
-
 New Zealand
-
 Nigeria
-
 North Macedonia
-
 Norway
-
 Oman
Oman
-
 Pakistan
-
 Palestine
-
 Panama
-
 Papua New Guinea
-
 Paraguay
-
 Peru
Peru
-
 Philippines
-
 Poland
-
 Portugal
-
 Puerto Rico
-
 Qatar
Qatar
-
 Reunion
-
 Romania
-
 Rwanda
-
 Saudi Arabia
-
 Serbia
-
 Singapore
-
 Slovakia
-
 Slovenia
-
 Somalia
-
 South Africa
-
 Spain
Spain
-
 Sri Lanka
-
 Sweden
-
 Switzerland
-
 Syria
Syria
-
 Taiwan
-
 Tajikistan
-
 Tanzania
-
 Thailand
-
 Trinidad and Tobago
-
 Tunisia
-
 Turkey
-
 UAE
UAE
-
 Uganda
-
 Ukraine
-
 United Kingdom
-
United States
-
 Uruguay
-
 Uzbekistan
-
 Venezuela
-
 Vietnam
-
 Yemen
Yemen
-
 Zambia
-
 Zimbabwe
- Forex
- Crypto












