

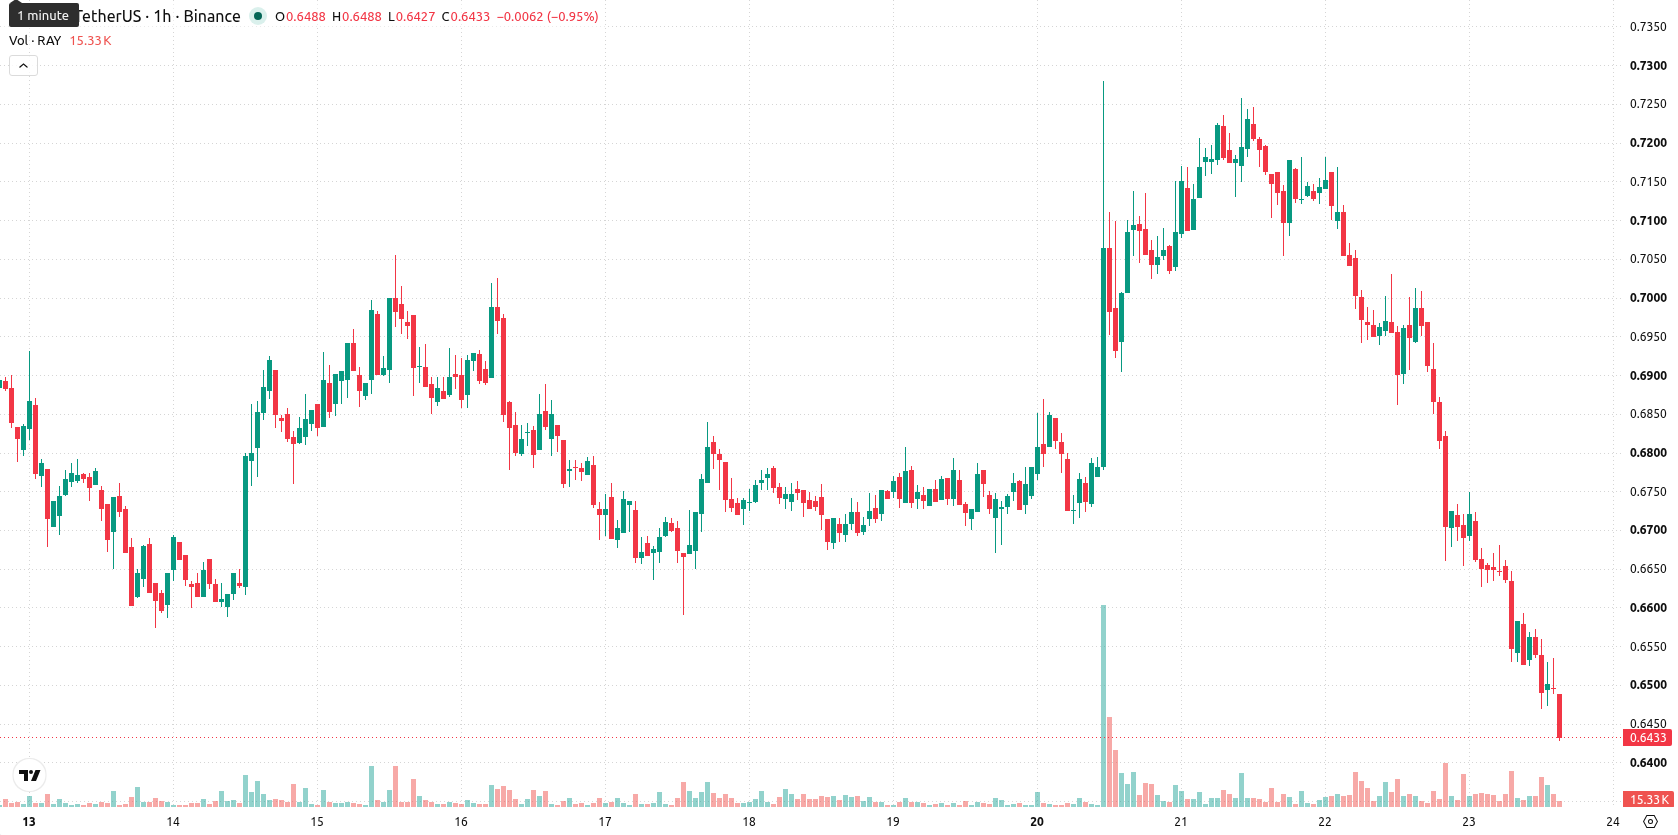
Raydium (RAY) is trading at $0.643 after a decline of 7.51% over the past day, marking a notable drop in value. The asset currently sits below its key moving averages, pointing to sustained short-term weakness.
 0.6355
0.7280
0.6355
0.7280
Highlights
- RAY/USD remains in a clear bearish trend, consistently trading below key short-, medium-, and long-term moving averages.
- Momentum indicators confirm strong selling pressure, with persistent bearish signals and oversold readings indicating downside risk despite some oscillators showing divergence.
- Price is expected to consolidate between $0.6254 and $0.6584 over the next few days, with a significant probability of further declines unless resistance at $0.6741 is reclaimed.
Bearish momentum confirmed as oscillators diverge with resistance ahead
On the technical front, RAY/USD is trading below the MA-20 ($0.6626) and MA-50 ($0.6878) on the hourly timeframe, as well as remaining well under the MA-200 ($0.7204) on the daily chart. The Ichimoku Kijun at $0.6741 serves as immediate resistance. Momentum indicators reinforce this bearish setup: MACD and ADX both show strong sell momentum, while the RSI has fallen to 26.949 (Sell). CCI reads as Oversold and Stoch RSI is Overbought, creating notable divergence among oscillators. Bull/Bear Power reflects intraday dominance by sellers, whereas the Awesome Oscillator stands neutral, not amplifying the prevailing direction.
High downside risk as volatility limits breakout odds
Over the next 2–3 trading days, price action is projected to remain volatile within the $0.6254 to $0.6584 band. The probability of an upward breakout is very low, while further downside risk is high. Base case expectations favor consolidation inside this volatility band; a sustained move above $0.6741 would be required to shift the outlook bullish, while a drop through $0.6254 would likely accelerate additional downside.
Previously it was reported that Raydium had shifted into a bullish posture, with analysts watching for signs of an upside breakout. The current technical setup marks a distinct transition to short-term bearish momentum, suggesting traders should closely monitor for any violation of the $0.6254 support as an early warning of further downside risk.








-
 Afghanistan
-
 Albania
-
 Algeria
-
 Angola
-
 Argentina
-
 Armenia
-
 Australia
-
 Austria
-
 Azerbaijan
-
 Bahamas
-
 Bahrain
-
 Bangladesh
-
 Belarus
-
 Belgium
-
 Bolivia
-
 Botswana
-
 Brazil
-
 Brunei
-
 Bulgaria
-
 Cambodia
-
 Cameroon
-
 Canada
-
 Chile
Chile
-
 China
China
-
 Colombia
-
 Congo
Congo
-
 Costa Rica
-
 Cote d'Ivoire
-
 Croatia
-
 Cuba
Cuba
-
 Cyprus
-
 Czechia
-
 DR Congo
-
 Denmark
-
 Dominican Republic
-
 Ecuador
-
 Egypt
Egypt
-
 El Salvador
-
 Estonia
-
 Eswatini
-
 Ethiopia
-
 Finland
-
 France
-
 Georgia
-
 Germany
-
 Ghana
Ghana
-
 Greece
-
 Haiti
Haiti
-
 Hong Kong
-
 Hungary
-
 India
India
-
 Indonesia
-
 Iran, Islamic republic
-
 Iraq
Iraq
-
 Ireland
-
 Israel
-
 Italy
Italy
-
 Jamaica
-
 Japan
Japan
-
 Jordan
-
 Kazakhstan
-
 Kenya
Kenya
-
 Korea
Korea
-
 Kuwait
-
 Kyrgyzstan
-
 Laos
Laos
-
 Latvia
-
 Lebanon
-
 Lesotho
-
 Libya
Libya
-
 Lithuania
-
 Luxembourg
-
 Madagascar
-
 Malaysia
-
 Malta
Malta
-
 Mauritius
-
 Mexico
-
 Moldova
-
 Mongolia
-
 Montenegro
-
 Morocco
-
 Mozambique
-
 Myanmar
-
 Namibia
-
 Nepal
Nepal
-
 Netherlands
-
 New Zealand
-
 Nigeria
-
 North Macedonia
-
 Norway
-
 Oman
Oman
-
 Pakistan
-
 Palestine
-
 Panama
-
 Papua New Guinea
-
 Paraguay
-
 Peru
Peru
-
 Philippines
-
 Poland
-
 Portugal
-
 Puerto Rico
-
 Qatar
Qatar
-
 Reunion
-
 Romania
-
 Rwanda
-
 Saudi Arabia
-
 Serbia
-
 Singapore
-
 Slovakia
-
 Slovenia
-
 Somalia
-
 South Africa
-
 Spain
Spain
-
 Sri Lanka
-
 Sweden
-
 Switzerland
-
 Syria
Syria
-
 Taiwan
-
 Tajikistan
-
 Tanzania
-
 Thailand
-
 Trinidad and Tobago
-
 Tunisia
-
 Turkey
-
 UAE
UAE
-
 Uganda
-
 Ukraine
-
 United Kingdom
-
United States
-
 Uruguay
-
 Uzbekistan
-
 Venezuela
-
 Vietnam
-
 Yemen
Yemen
-
 Zambia
-
 Zimbabwe
- Forex
- Crypto












