

The Graph weekly forecast: Weak structure persists with resistance capped by the 20-day moving average

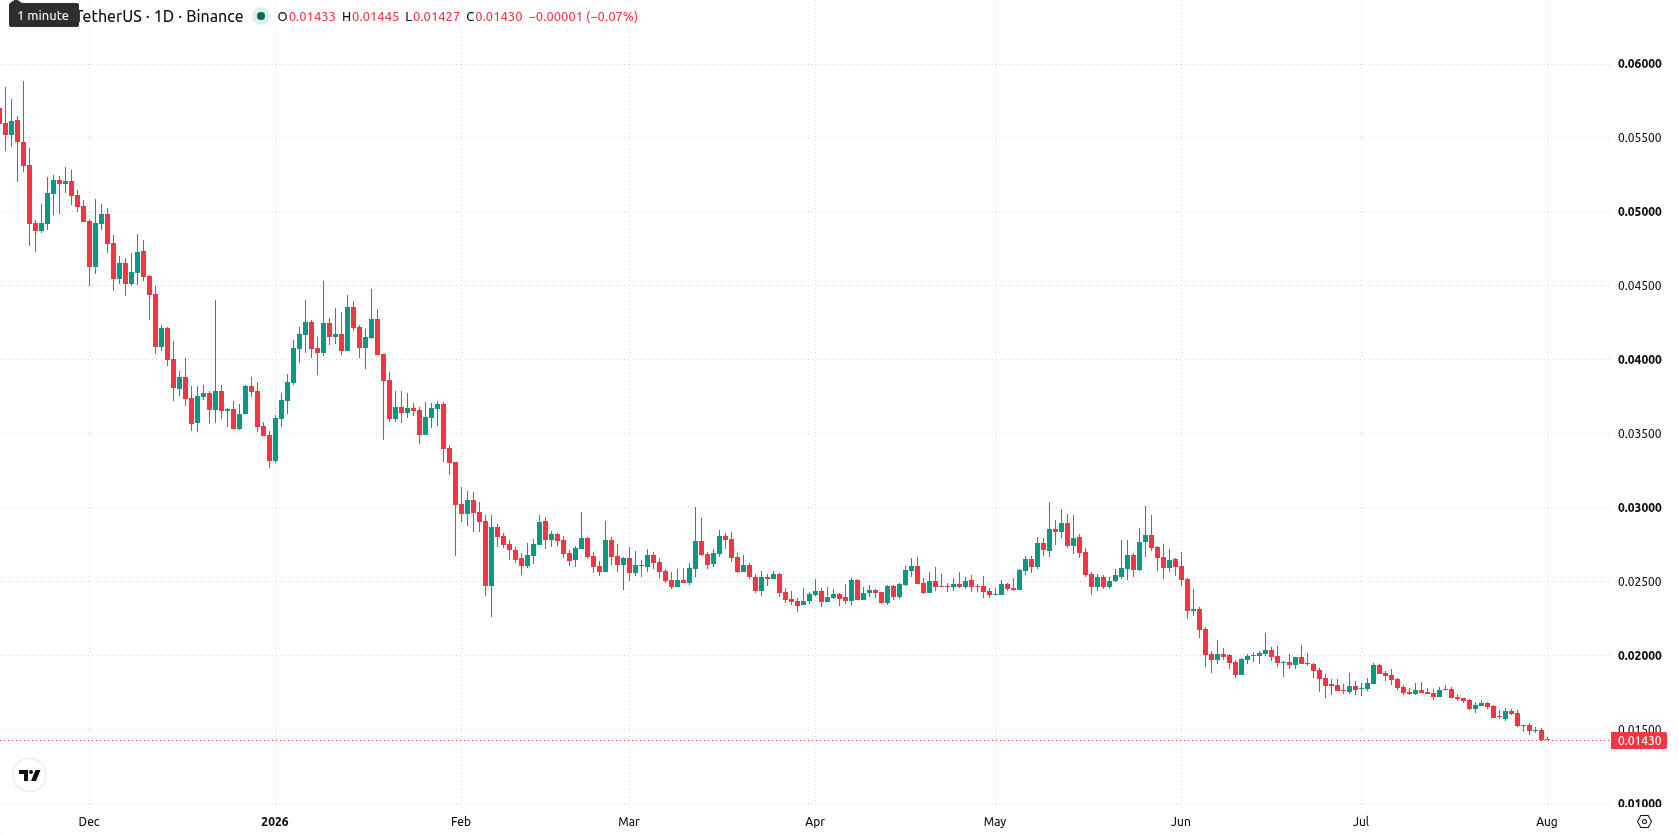
The Graph (GRT) is trading near $0.014, after a drop of around 9% over the past week as downside pressure remained dominant. With support coming into focus following an extended decline, the coming week will test whether sellers can break through or if a pause develops above the current floor.
 0.01623
0.01898000
Highlights
- The Graph is down 9.22% over the past week, showing pronounced underperformance as it remains below key technical averages.
- Momentum indicators remain strongly bearish, with persistent weakness and price activity deep in oversold territory on the daily chart.
- Expected trading range is $0.01315 to $0.01547 over the next week, with a high probability of further declines unless $0.01632 resistance is reclaimed.
Bearish momentum persists as oversold signals and weak structure dominate
On the daily chart, the structure remains weak with a sustained move lower and a firm trend, as indicated by the 15.53% weekly volatility. Key momentum signals support the bearish view: the RSI is deep in the oversold zone at 22.37 and the MACD continues to point down. Nearest support is at $0.01417, with resistance aligned to the 20-day moving average at $0.016323 and the Ichimoku Kijun acting as a further ceiling at $0.016625. On the weekly timeframe, the broader backdrop stays firmly negative, suggesting momentum could persist in the coming sessions.
Further losses likely over the week as support faces renewed tests
Over the next 7 days, the expected range is $0.01314586 to $0.01547413. There is a very high probability (more than 80%) of further declines, and a very low probability (less than 20%) of a rebound. The base case sees the pair holding just above $0.01417 support and drifting within the quoted range. A move above $0.016323 would be needed to challenge resistance and open to recovery. If $0.01417 is lost, the path opens for deeper downside toward the lower end of the range.
Earlier, analysts noted that The Graph remained in a prolonged bearish trend with persistent downside momentum and little evidence of recovery. Fresh technical signals in the current setup reinforce this negative outlook, making the $0.01417 support a critical level for traders to monitor as a breakdown could accelerate further declines.











-
 Afghanistan
-
 Albania
-
 Algeria
-
 Angola
-
 Argentina
-
 Armenia
-
 Australia
-
 Austria
-
 Azerbaijan
-
 Bahamas
-
 Bahrain
-
 Bangladesh
-
 Belarus
-
 Belgium
-
 Bolivia
-
 Botswana
-
 Brazil
-
 Brunei
-
 Bulgaria
-
 Cambodia
-
 Cameroon
-
 Canada
-
 Chile
-
 China
-
 Colombia
-
 Congo
-
 Costa Rica
-
 Cote d'Ivoire
-
 Croatia
-
 Cuba
-
 Cyprus
-
 Czechia
-
 DR Congo
-
 Denmark
-
 Dominican Republic
-
 Ecuador
-
 Egypt
-
 El Salvador
-
 Estonia
-
 Eswatini
-
 Ethiopia
-
 Finland
-
 France
-
 Georgia
-
 Germany
-
 Ghana
-
 Greece
-
 Haiti
-
 Hong Kong
-
 Hungary
-
 India
-
 Indonesia
-
 Iran, Islamic republic
-
 Iraq
-
 Ireland
-
 Israel
-
 Italy
-
 Jamaica
-
 Japan
-
 Jordan
-
 Kazakhstan
-
 Kenya
-
 Korea
-
 Kuwait
-
 Kyrgyzstan
-
 Laos
-
 Latvia
-
 Lebanon
-
 Lesotho
-
 Libya
-
 Lithuania
-
 Luxembourg
-
 Madagascar
-
 Malaysia
-
 Malta
-
 Mauritius
-
 Mexico
-
 Moldova
-
 Mongolia
-
 Montenegro
-
 Morocco
-
 Mozambique
-
 Myanmar
-
 Namibia
-
 Nepal
-
 Netherlands
-
 New Zealand
-
 Nigeria
-
 North Macedonia
-
 Norway
-
 Oman
-
 Pakistan
-
 Palestine
-
 Panama
-
 Papua New Guinea
-
 Paraguay
-
 Peru
-
 Philippines
-
 Poland
-
 Portugal
-
 Puerto Rico
-
 Qatar
-
 Reunion
-
 Romania
-
 Rwanda
-
 Saudi Arabia
-
 Serbia
-
 Singapore
-
 Slovakia
-
 Slovenia
-
 Somalia
-
 South Africa
-
 Spain
-
 Sri Lanka
-
 Sweden
-
 Switzerland
-
 Syria
-
 Taiwan
-
 Tajikistan
-
 Tanzania
-
 Thailand
-
 Trinidad and Tobago
-
 Tunisia
-
 Turkey
-
 UAE
-
 Uganda
-
 Ukraine
-
 United Kingdom
-
United States
-
 Uruguay
-
 Uzbekistan
-
 Venezuela
-
 Vietnam
-
 Yemen
-
 Zambia
-
 Zimbabwe
- Forex
- Crypto












