

U.S. spot Bitcoin ETFs $132M inflows late July support Bitcoin near $61,183

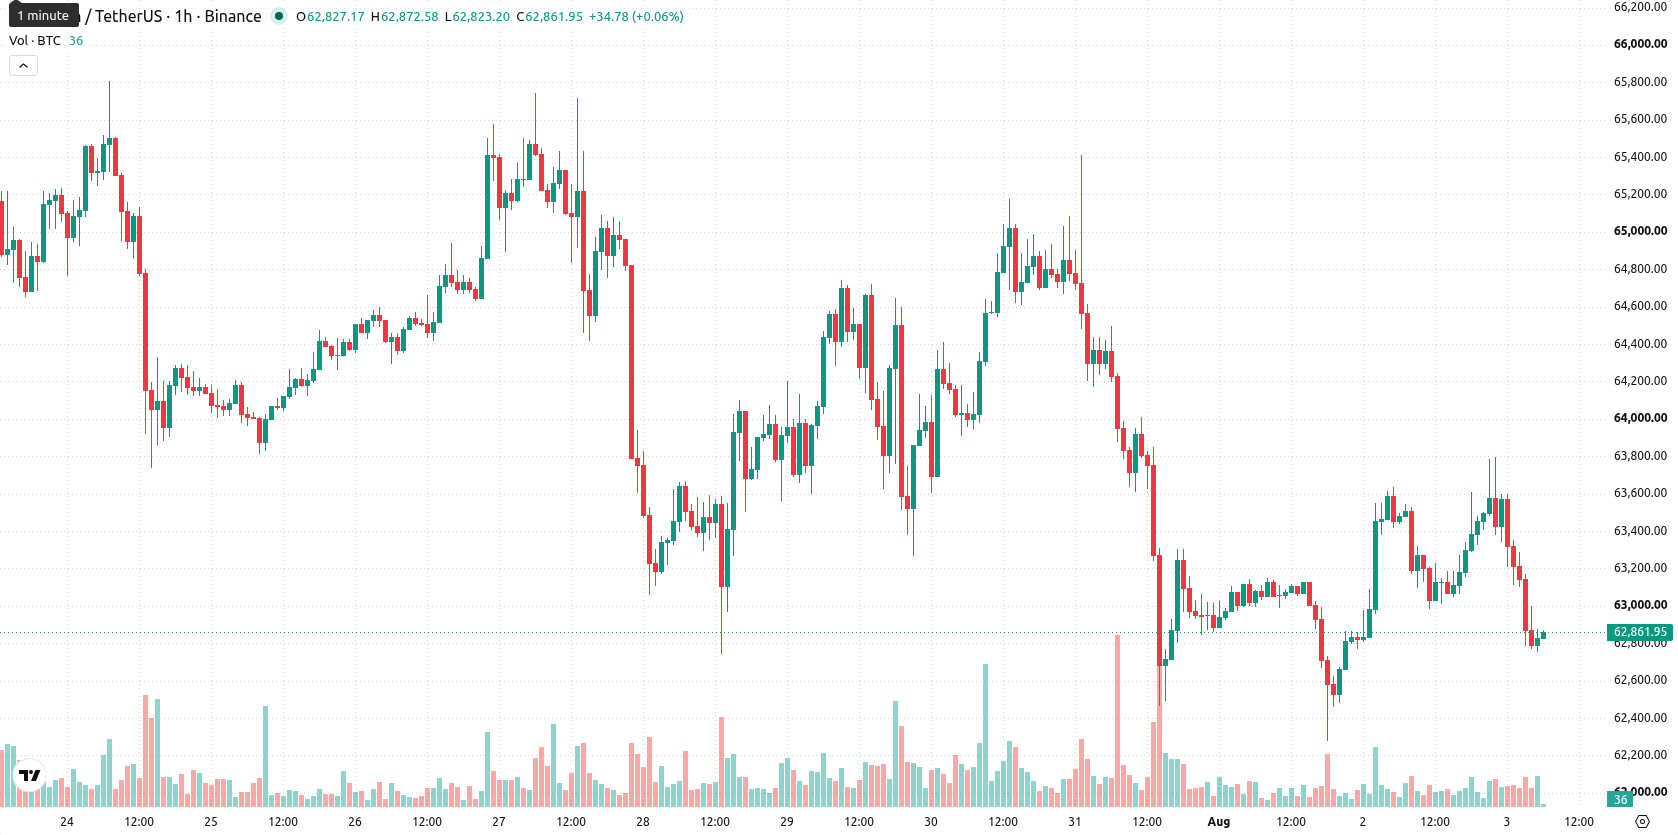
Bitcoin (BTC) is trading at $62,828, marking a modest decline on the day. The coin remains positioned below its key moving averages.
 78878.01
81971.00
Highlights
- Michael Saylor clarified that Strategy Inc.'s $5 billion bitcoin sale authorization is not new, easing fears of imminent heavy liquidation.
- U.S. spot Bitcoin ETFs drew $132 million in inflows over four sessions in late July, signaling sustained institutional demand.
- BTC/USD remains under persistent downside pressure, with the 2–3 day range forecasted at $61,183 to $63,528 and bearish signals prevailing across momentum indicators.
Saylor’s clarification and ETF inflows ease selloff fears amid pressure
Investor focus centered on Michael Saylor's clarification that Strategy Inc.’s authorization to sell up to $5 billion in bitcoin dates to June, rather than being a fresh trigger, which helped ease market concerns about imminent large-scale disposal, according to Dmarketforces. Additionally, U.S. spot Bitcoin ETFs recorded $132 million in inflows across four consecutive trading sessions in late July, per Fxleaders, reflecting ongoing institutional participation and liquidity in the asset. These developments shaped sentiment during the period, though price action has remained under broader selling pressure.
Technical momentum mixed as key resistances limit recovery
BTC/USD is currently trading below the MA-20 and MA-50 on the H1 chart, and remains under the MA-200 on the daily timeframe. The Ichimoku Kijun is set at $63,291 as immediate resistance. Momentum readings are mixed: MACD and ADX both show neutral conditions, while the RSI indicates a Sell bias. Oversold conditions are flagged by Stochastic RSI, CCI, and Bull/Bear Power, while the Awesome Oscillator confirms strong selling pressure.
Prevailing downside risk as breakout levels define near-term trend
In the short term, BTC/USD is expected to trade within the $61,183 to $63,528 corridor over the next two to three sessions. With a 74% probability of continued downside and only a 26% chance of an upward move, the prevailing scenario points to a potential decline within the established range. A bullish short-term reversal would require a breakout above immediate resistance, while a drop below support at $61,183 could accelerate the negative trend.
Earlier, analysts noted that Bitcoin’s rebound above short- and medium-term technical levels was complicated by ongoing institutional outflows and subdued buyer conviction. With fresh institutional inflows now observed alongside persistent selling momentum, traders should monitor whether renewed demand at current levels can offset downside risks and establish a foundation for recovery.






Latest Bitcoin News



-
 Afghanistan
-
 Albania
-
 Algeria
-
 Angola
-
 Argentina
-
 Armenia
-
 Australia
-
 Austria
-
 Azerbaijan
-
 Bahamas
-
 Bahrain
-
 Bangladesh
-
 Belarus
-
 Belgium
-
 Bolivia
-
 Botswana
-
 Brazil
-
 Brunei
-
 Bulgaria
-
 Cambodia
-
 Cameroon
-
 Canada
-
 Chile
-
 China
-
 Colombia
-
 Congo
-
 Costa Rica
-
 Cote d'Ivoire
-
 Croatia
-
 Cuba
-
 Cyprus
-
 Czechia
-
 DR Congo
-
 Denmark
-
 Dominican Republic
-
 Ecuador
-
 Egypt
-
 El Salvador
-
 Estonia
-
 Eswatini
-
 Ethiopia
-
 Finland
-
 France
-
 Georgia
-
 Germany
-
 Ghana
-
 Greece
-
 Haiti
-
 Hong Kong
-
 Hungary
-
 India
-
 Indonesia
-
 Iran, Islamic republic
-
 Iraq
-
 Ireland
-
 Israel
-
 Italy
-
 Jamaica
-
 Japan
-
 Jordan
-
 Kazakhstan
-
 Kenya
-
 Korea
-
 Kuwait
-
 Kyrgyzstan
-
 Laos
-
 Latvia
-
 Lebanon
-
 Lesotho
-
 Libya
-
 Lithuania
-
 Luxembourg
-
 Madagascar
-
 Malaysia
-
 Malta
-
 Mauritius
-
 Mexico
-
 Moldova
-
 Mongolia
-
 Montenegro
-
 Morocco
-
 Mozambique
-
 Myanmar
-
 Namibia
-
 Nepal
-
 Netherlands
-
 New Zealand
-
 Nigeria
-
 North Macedonia
-
 Norway
-
 Oman
-
 Pakistan
-
 Palestine
-
 Panama
-
 Papua New Guinea
-
 Paraguay
-
 Peru
-
 Philippines
-
 Poland
-
 Portugal
-
 Puerto Rico
-
 Qatar
-
 Reunion
-
 Romania
-
 Rwanda
-
 Saudi Arabia
-
 Serbia
-
 Singapore
-
 Slovakia
-
 Slovenia
-
 Somalia
-
 South Africa
-
 Spain
-
 Sri Lanka
-
 Sweden
-
 Switzerland
-
 Syria
-
 Taiwan
-
 Tajikistan
-
 Tanzania
-
 Thailand
-
 Trinidad and Tobago
-
 Tunisia
-
 Turkey
-
 UAE
-
 Uganda
-
 Ukraine
-
 United Kingdom
-
United States
-
 Uruguay
-
 Uzbekistan
-
 Venezuela
-
 Vietnam
-
 Yemen
-
 Zambia
-
 Zimbabwe
- Forex
- Crypto












