


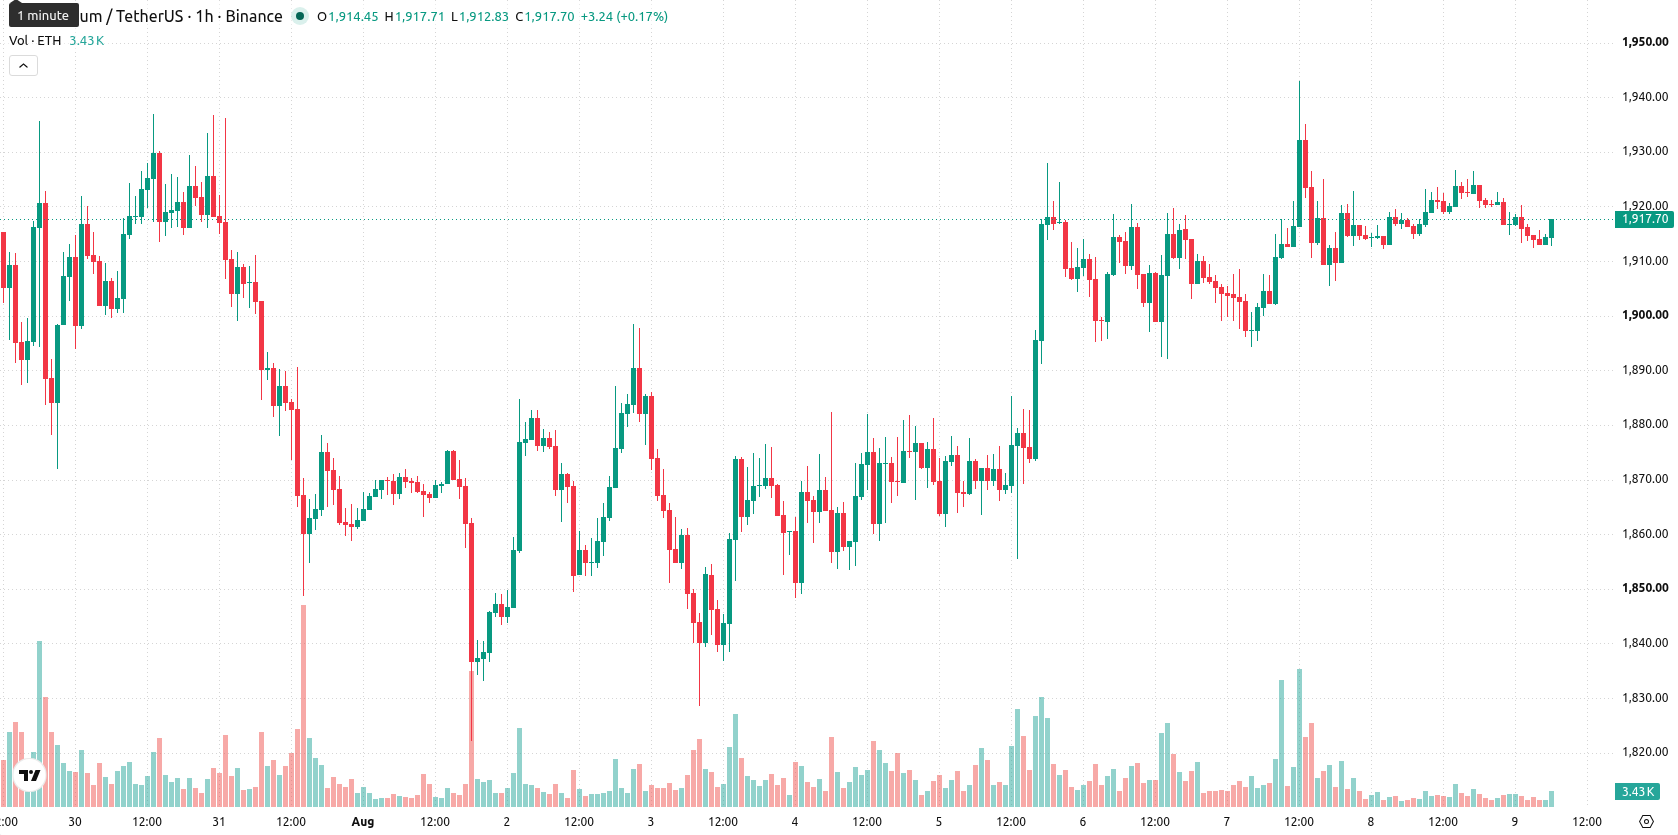
Ethereum (ETH) is trading at $1,916.83, with minimal change on the day, reflecting extremely low volatility. The asset is consolidating, holding above its medium-term moving averages but below short-term signals, as price action remains tightly rangebound.
 2281.15
2379.55
Highlights
- Ethereum attracted $244.94 million in net inflows to U.S.-listed spot ETFs for the week ending August 8, 2026, with BlackRock and Fidelity leading participation.
- Large holders were actively repositioning as two whales accumulated 80,000 ETH totaling $152 million, while one whale exited with a $19 million loss amid validator rejection of EIP-8361.
- ETH trades in heavy consolidation with downside bias, projected to range between $1,891 and $1,942 as oversold momentum persists.
Institutional inflows and whale repositioning drive on-exchange demand
Ethereum saw substantial inflows into U.S.-listed spot ETFs during the week ending August 8, 2026, with $244.94 million in net new investments led by BlackRock and Fidelity, according to Cryptoslate and Bitcoinworld Co. This institutional activity has boosted on-exchange demand for ETH, increasing liquidity and market participation. On-chain data also revealed that two whales accumulated 80,000 ETH valued at $152 million, while another whale exited with a $19 million realized loss, highlighting active repositioning by large holders. Meanwhile, the rejection of EIP-8361 by 99.7% of voting validators, as noted by Yellow, maintains the status quo for staking rewards and removes immediate regulatory uncertainty for stakers.
Mixed momentum and defined support reinforce intraday selling pressure
ETH/USD trades below the MA-20 and faces immediate resistance at the Ichimoku Kijun level of $1,919. Support is established at the MA-50, with the longer-term bearish structure confirmed by price remaining under the MA-200 at $2,056. Momentum signals are mixed: RSI stands at 42.96 (Sell), MACD is Neutral, and ADX shows Buy, while Stochastic RSI, CCI, and Bull/Bear Power all reside in oversold territory, suggesting intraday dominance by sellers. The Awesome Oscillator aligns with this tone, underlining ongoing selling pressure despite a flat session and confirmed consolidation.
Sideways trading likely as breakout odds remain finely balanced
Over the next one to two trading days, ETH is expected to remain rangebound between $1,891 and $1,942, in line with typical volatility for the current environment. The probability of an upside break is estimated at 52%, with a 48% chance of further downside. The baseline scenario is continued sideways action within this corridor. A bullish scenario would require a sustained move above immediate resistance at $1,919 to trigger short-covering, while a drop below $1,891 could open the way to new lows and increased selling pressure.
Earlier, analysts noted that Ethereum maintained a constructive technical outlook bolstered by ongoing institutional inflows. The current analysis adds further dimension by highlighting substantial recent ETF allocations and on-chain whale repositioning, with traders advised to monitor the $1,919 resistance level as a potential trigger for near-term directional moves.











-
 Afghanistan
-
 Albania
-
 Algeria
-
 Angola
-
 Argentina
-
 Armenia
-
 Australia
-
 Austria
-
 Azerbaijan
-
 Bahamas
-
 Bahrain
-
 Bangladesh
-
 Belarus
-
 Belgium
-
 Bolivia
-
 Botswana
-
 Brazil
-
 Brunei
-
 Bulgaria
-
 Cambodia
-
 Cameroon
-
 Canada
-
 Chile
-
 China
-
 Colombia
-
 Congo
-
 Costa Rica
-
 Cote d'Ivoire
-
 Croatia
-
 Cuba
-
 Cyprus
-
 Czechia
-
 DR Congo
-
 Denmark
-
 Dominican Republic
-
 Ecuador
-
 Egypt
-
 El Salvador
-
 Estonia
-
 Eswatini
-
 Ethiopia
-
 Finland
-
 France
-
 Georgia
-
 Germany
-
 Ghana
-
 Greece
-
 Haiti
-
 Hong Kong
-
 Hungary
-
 India
-
 Indonesia
-
 Iran, Islamic republic
-
 Iraq
-
 Ireland
-
 Israel
-
 Italy
-
 Jamaica
-
 Japan
-
 Jordan
-
 Kazakhstan
-
 Kenya
-
 Korea
-
 Kuwait
-
 Kyrgyzstan
-
 Laos
-
 Latvia
-
 Lebanon
-
 Lesotho
-
 Libya
-
 Lithuania
-
 Luxembourg
-
 Madagascar
-
 Malaysia
-
 Malta
-
 Mauritius
-
 Mexico
-
 Moldova
-
 Mongolia
-
 Montenegro
-
 Morocco
-
 Mozambique
-
 Myanmar
-
 Namibia
-
 Nepal
-
 Netherlands
-
 New Zealand
-
 Nigeria
-
 North Macedonia
-
 Norway
-
 Oman
-
 Pakistan
-
 Palestine
-
 Panama
-
 Papua New Guinea
-
 Paraguay
-
 Peru
-
 Philippines
-
 Poland
-
 Portugal
-
 Puerto Rico
-
 Qatar
-
 Reunion
-
 Romania
-
 Rwanda
-
 Saudi Arabia
-
 Serbia
-
 Singapore
-
 Slovakia
-
 Slovenia
-
 Somalia
-
 South Africa
-
 Spain
-
 Sri Lanka
-
 Sweden
-
 Switzerland
-
 Syria
-
 Taiwan
-
 Tajikistan
-
 Tanzania
-
 Thailand
-
 Trinidad and Tobago
-
 Tunisia
-
 Turkey
-
 UAE
-
 Uganda
-
 Ukraine
-
 United Kingdom
-
United States
-
 Uruguay
-
 Uzbekistan
-
 Venezuela
-
 Vietnam
-
 Yemen
-
 Zambia
-
 Zimbabwe
- Forex
- Crypto












