

Why is Movement falling today? Sustained sell momentum, key support in focus

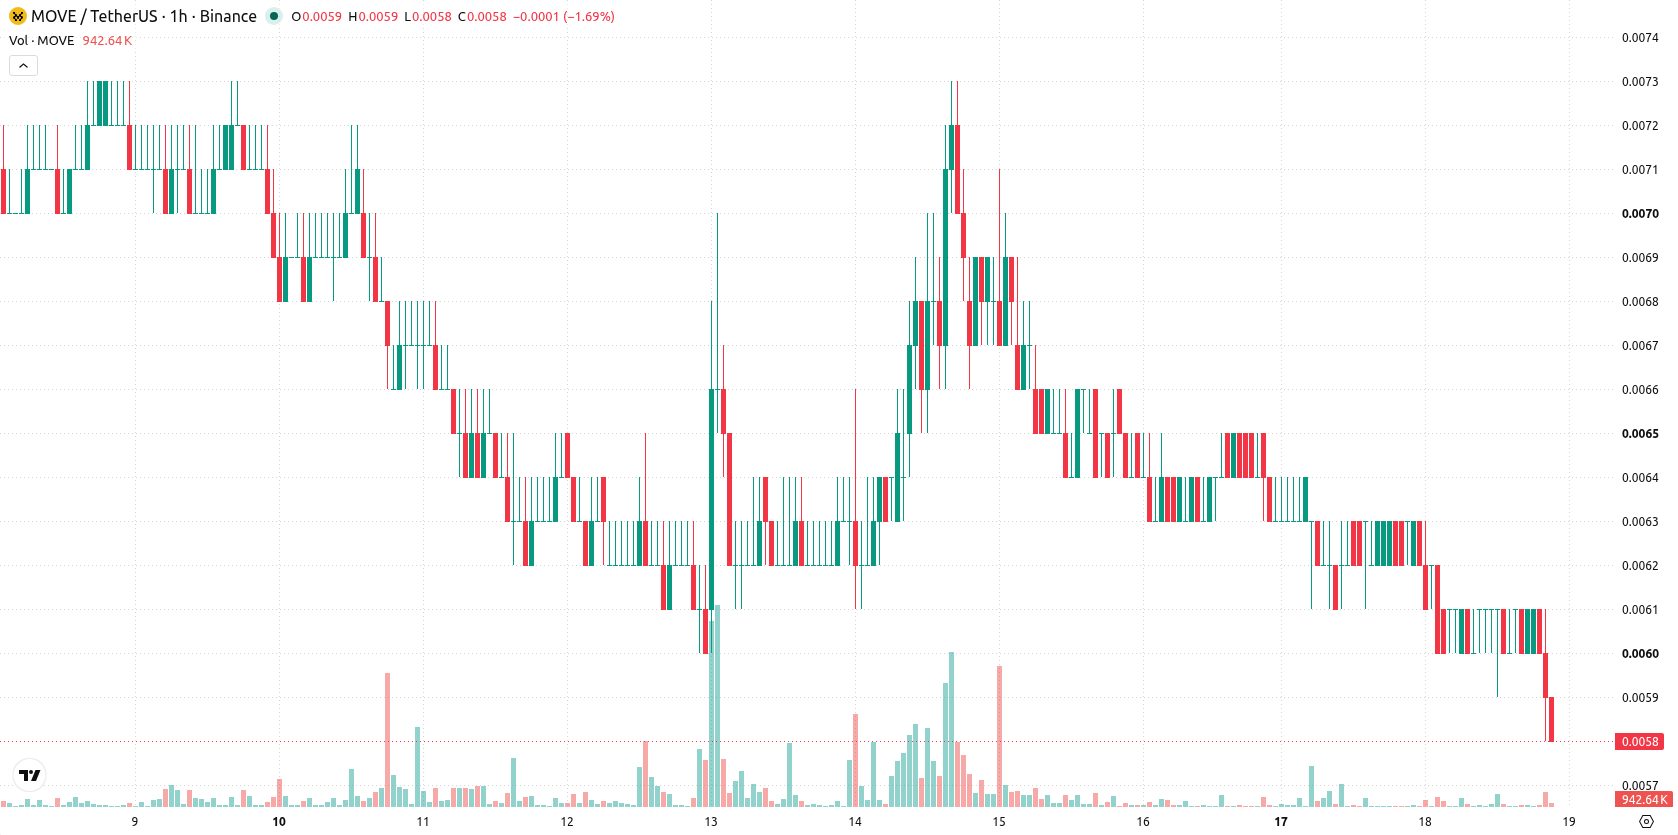
Movement (MOVE) is trading at $0.0058, marking a decline of 7.94% for the day. The price continues to trend below its core moving averages, highlighting sustained downside pressure in the near term.
 0.0086
0.009866
0.0086
0.009866
Highlights
- MOVE/USD remains below key moving averages across all timeframes, confirming a persistent bearish structure.
- Momentum indicators such as MACD, ADX, and RSI all give sell signals, with no relief from oversold conditions.
- Price closed at $0.0058, down 7.94%, with a projected range of $0.0055 to $0.0061 and a very high probability of continued downward movement.
Sell signals dominate as technical boundaries reinforce pressure
MOVE/USD remains technically pressured as it trades below the MA-20 ($0.0061), MA-50 ($0.0062), and MA-200 ($0.0162). The Ichimoku Kijun sits at $0.0061, serving as immediate resistance. MACD and ADX readings both reinforce ongoing sell momentum, while RSI prints at 42.60 and CCI also signals sell. Stochastic RSI and the Awesome Oscillator are each neutral. Bull/Bear Power shows some intraday buyer activity, in contrast to the heavier sell signals elsewhere, as the price ended the day near the session low with high volatility.
Downside scenario favored as breakout odds diminish
For the next 2–3 days, MOVE/USD is expected to trade within a range of $0.0055–$0.0061 as typical volatility persists. The likelihood of a short-term upward breakout above $0.0061 is very low, with a continued downward scenario rated as very high probability. If support at $0.0055 breaks, further downside could unfold, whereas a pause in selling would keep price action contained within the established corridor.
Earlier, analysts noted that Movement was entrenched in a persistent downtrend with only minor technical rebounds providing limited relief. The current analysis strengthens this bearish outlook with renewed technical evidence, and traders should be alert to further downside risk if the $0.0055 support level fails in the coming days.





Latest Movement News





-
 Afghanistan
-
 Albania
-
 Algeria
-
 Angola
-
 Argentina
-
 Armenia
-
 Australia
-
 Austria
-
 Azerbaijan
-
 Bahamas
-
 Bahrain
-
 Bangladesh
-
 Belarus
-
 Belgium
-
 Bolivia
-
 Botswana
-
 Brazil
-
 Brunei
-
 Bulgaria
-
 Cambodia
-
 Cameroon
-
 Canada
-
 Chile
Chile
-
 China
China
-
 Colombia
-
 Congo
Congo
-
 Costa Rica
-
 Cote d'Ivoire
-
 Croatia
-
 Cuba
Cuba
-
 Cyprus
-
 Czechia
-
 DR Congo
-
 Denmark
-
 Dominican Republic
-
 Ecuador
-
 Egypt
Egypt
-
 El Salvador
-
 Estonia
-
 Eswatini
-
 Ethiopia
-
 Finland
-
 France
-
 Georgia
-
 Germany
-
 Ghana
Ghana
-
 Greece
-
 Haiti
Haiti
-
 Hong Kong
-
 Hungary
-
 India
India
-
 Indonesia
-
 Iran, Islamic republic
-
 Iraq
Iraq
-
 Ireland
-
 Israel
-
 Italy
Italy
-
 Jamaica
-
 Japan
Japan
-
 Jordan
-
 Kazakhstan
-
 Kenya
Kenya
-
 Korea
Korea
-
 Kuwait
-
 Kyrgyzstan
-
 Laos
Laos
-
 Latvia
-
 Lebanon
-
 Lesotho
-
 Libya
Libya
-
 Lithuania
-
 Luxembourg
-
 Madagascar
-
 Malaysia
-
 Malta
Malta
-
 Mauritius
-
 Mexico
-
 Moldova
-
 Mongolia
-
 Montenegro
-
 Morocco
-
 Mozambique
-
 Myanmar
-
 Namibia
-
 Nepal
Nepal
-
 Netherlands
-
 New Zealand
-
 Nigeria
-
 North Macedonia
-
 Norway
-
 Oman
Oman
-
 Pakistan
-
 Palestine
-
 Panama
-
 Papua New Guinea
-
 Paraguay
-
 Peru
Peru
-
 Philippines
-
 Poland
-
 Portugal
-
 Puerto Rico
-
 Qatar
Qatar
-
 Reunion
-
 Romania
-
 Rwanda
-
 Saudi Arabia
-
 Serbia
-
 Singapore
-
 Slovakia
-
 Slovenia
-
 Somalia
-
 South Africa
-
 Spain
Spain
-
 Sri Lanka
-
 Sweden
-
 Switzerland
-
 Syria
Syria
-
 Taiwan
-
 Tajikistan
-
 Tanzania
-
 Thailand
-
 Trinidad and Tobago
-
 Tunisia
-
 Turkey
-
 UAE
UAE
-
 Uganda
-
 Ukraine
-
 United Kingdom
-
United States
-
 Uruguay
-
 Uzbekistan
-
 Venezuela
-
 Vietnam
-
 Yemen
Yemen
-
 Zambia
-
 Zimbabwe
- Forex
- Crypto












