

The Graph technical analysis: Challenging $0.01632839 resistance after sharp rally

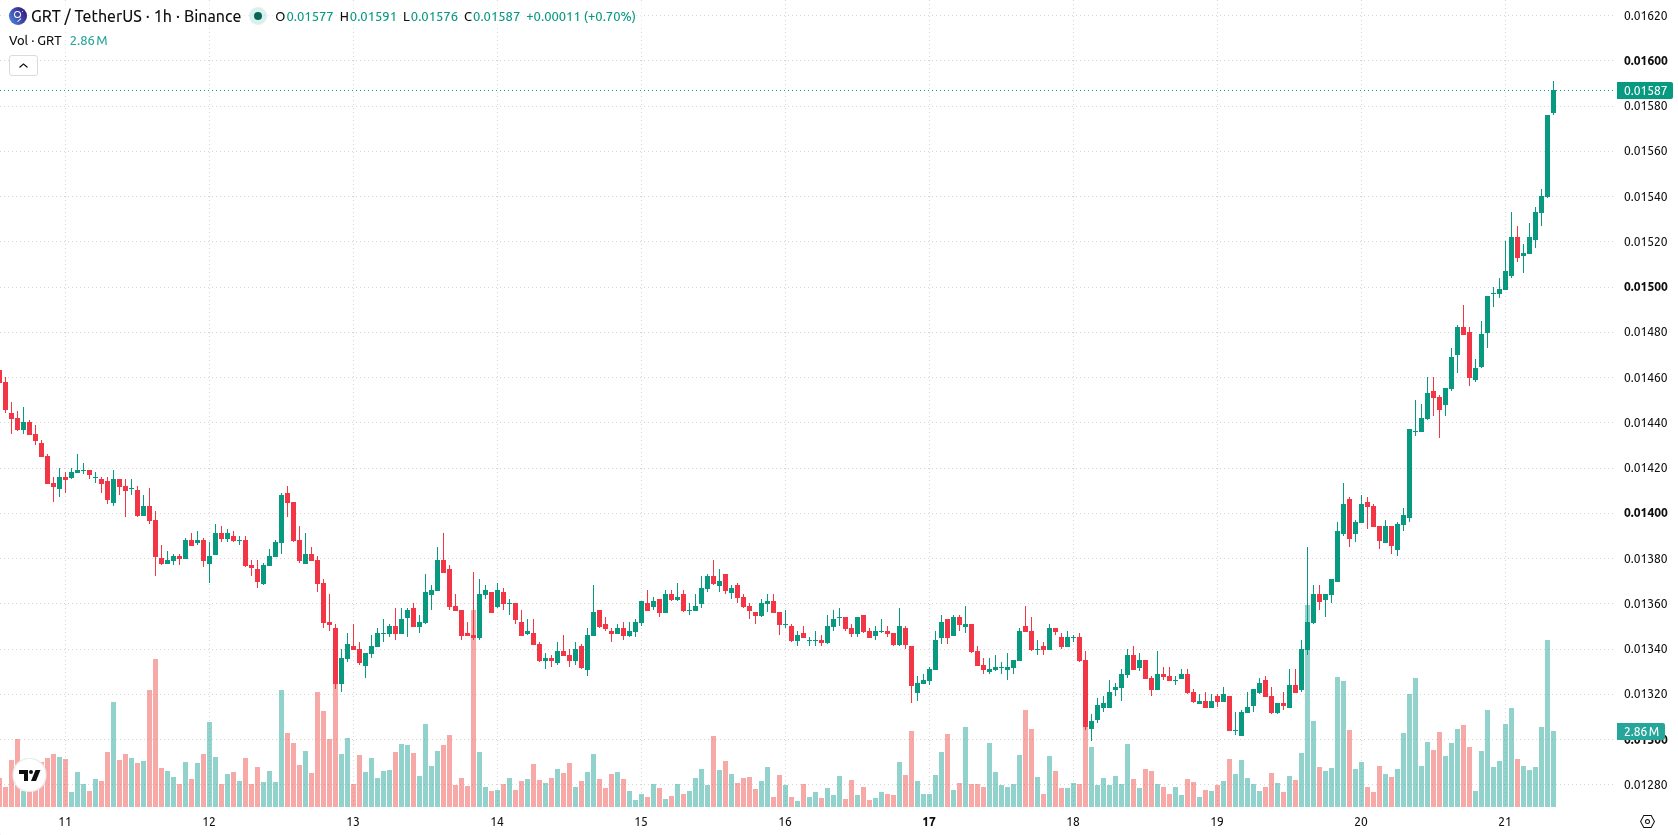
The Graph (GRT) is trading at $0.01587 after rising 11.29% today, posting a strong daily advance. The asset is positioned above its key short- and medium-term moving averages but remains capped below longer-term trend indicators.
 0.01623
0.01898000
Highlights
- GRT/USD gained 11.29% to $0.01587, trading near session highs with heightened volatility.
- Short- and medium-term momentum stays bullish with buyer dominance, but multiple indicators register overbought conditions.
- Over the next 2 to 3 days, price is projected to consolidate between $0.01541161 and $0.01632839, with a high probability of an upward move.
Overbought signals emerge as uptrend meets resistance cluster
GRT/USD is currently trading above the MA-20 at $0.0149405 and MA-50 at $0.0142198 on the hourly chart, indicating the short- and medium-term uptrend, while still facing resistance below the longer-term MA-200 at $0.02242045. The Ichimoku Kijun at $0.014705 marks immediate support. Hourly momentum remains strong, as both MACD and ADX display Buy signals. RSI is elevated at 81.68, with Stoch RSI and CCI both in overbought territory, and Bull/Bear Power continues to reflect buyer dominance in the current session. The Awesome Oscillator remains neutral and does not reinforce the price direction. Price action remains near session highs with significant volatility, yet a cluster of overbought oscillator readings signals caution due to potential short-term cooling.
Rally continuation likely as volatility narrows upside band
Looking ahead to the next two to three trading sessions, GRT/USD is expected to consolidate in a volatility band between $0.01541161 and $0.01632839. There is a high probability of upside continuation, with a move above $0.01632839 pointing to extension of the rally. Downside risk is limited, but a break below support could open the door to a pullback toward or below $0.01541161.
Earlier, analysts noted that The Graph had shifted toward a short-term bullish momentum, while still facing longer-term resistance. The latest price action strengthens this outlook, but with volatility and overbought signals building, traders should monitor for a potential reversal if immediate support at $0.014705 fails to hold.











-
 Afghanistan
-
 Albania
-
 Algeria
-
 Angola
-
 Argentina
-
 Armenia
-
 Australia
-
 Austria
-
 Azerbaijan
-
 Bahamas
-
 Bahrain
-
 Bangladesh
-
 Belarus
-
 Belgium
-
 Bolivia
-
 Botswana
-
 Brazil
-
 Brunei
-
 Bulgaria
-
 Cambodia
-
 Cameroon
-
 Canada
-
 Chile
-
 China
-
 Colombia
-
 Congo
-
 Costa Rica
-
 Cote d'Ivoire
-
 Croatia
-
 Cuba
-
 Cyprus
-
 Czechia
-
 DR Congo
-
 Denmark
-
 Dominican Republic
-
 Ecuador
-
 Egypt
-
 El Salvador
-
 Estonia
-
 Eswatini
-
 Ethiopia
-
 Finland
-
 France
-
 Georgia
-
 Germany
-
 Ghana
-
 Greece
-
 Haiti
-
 Hong Kong
-
 Hungary
-
 India
-
 Indonesia
-
 Iran, Islamic republic
-
 Iraq
-
 Ireland
-
 Israel
-
 Italy
-
 Jamaica
-
 Japan
-
 Jordan
-
 Kazakhstan
-
 Kenya
-
 Korea
-
 Kuwait
-
 Kyrgyzstan
-
 Laos
-
 Latvia
-
 Lebanon
-
 Lesotho
-
 Libya
-
 Lithuania
-
 Luxembourg
-
 Madagascar
-
 Malaysia
-
 Malta
-
 Mauritius
-
 Mexico
-
 Moldova
-
 Mongolia
-
 Montenegro
-
 Morocco
-
 Mozambique
-
 Myanmar
-
 Namibia
-
 Nepal
-
 Netherlands
-
 New Zealand
-
 Nigeria
-
 North Macedonia
-
 Norway
-
 Oman
-
 Pakistan
-
 Palestine
-
 Panama
-
 Papua New Guinea
-
 Paraguay
-
 Peru
-
 Philippines
-
 Poland
-
 Portugal
-
 Puerto Rico
-
 Qatar
-
 Reunion
-
 Romania
-
 Rwanda
-
 Saudi Arabia
-
 Serbia
-
 Singapore
-
 Slovakia
-
 Slovenia
-
 Somalia
-
 South Africa
-
 Spain
-
 Sri Lanka
-
 Sweden
-
 Switzerland
-
 Syria
-
 Taiwan
-
 Tajikistan
-
 Tanzania
-
 Thailand
-
 Trinidad and Tobago
-
 Tunisia
-
 Turkey
-
 UAE
-
 Uganda
-
 Ukraine
-
 United Kingdom
-
United States
-
 Uruguay
-
 Uzbekistan
-
 Venezuela
-
 Vietnam
-
 Yemen
-
 Zambia
-
 Zimbabwe
- Forex
- Crypto












