


Polkadot (DOT) surged 6.68% after Grayscale Investments withdrew its planned Polkadot Trust ETF registration, with buyers focusing on the project's evolving fundamentals and recent tokenomics changes. The move is supported in the near term by a bullish technical posture above key moving averages, though lingering long-term resistance and mixed momentum limit conviction.
 1.171
1.296
1.171
1.296
Highlights
- Grayscale Investments withdrew its planned Polkadot Trust ETF registration with the SEC due to shifting business priorities, not regulatory rejection.
- Polkadot implemented a hard cap of 2.1 billion DOT and reduced annual token issuance by 53.6%, driving increased developer activity and transactions.
- DOT/USD trades in a bullish short- and medium-term structure with mixed momentum signals and an expected five-session range of $0.83 to $0.958.
Tokenomics overhaul and developer uptick drive renewed optimism
Grayscale Investments withdrew its planned Polkadot Trust ETF registration with the SEC on August 7, 2026, citing business priorities rather than a regulatory rejection. In March 2026, Polkadot introduced a major tokenomics upgrade by implementing a hard cap of 2.1 billion DOT and reducing annual token issuance by 53.6%. The rollout of Polkadot 2.0 and Agile Coretime also led to a notable increase in developer activity, with daily transactions rising significantly.
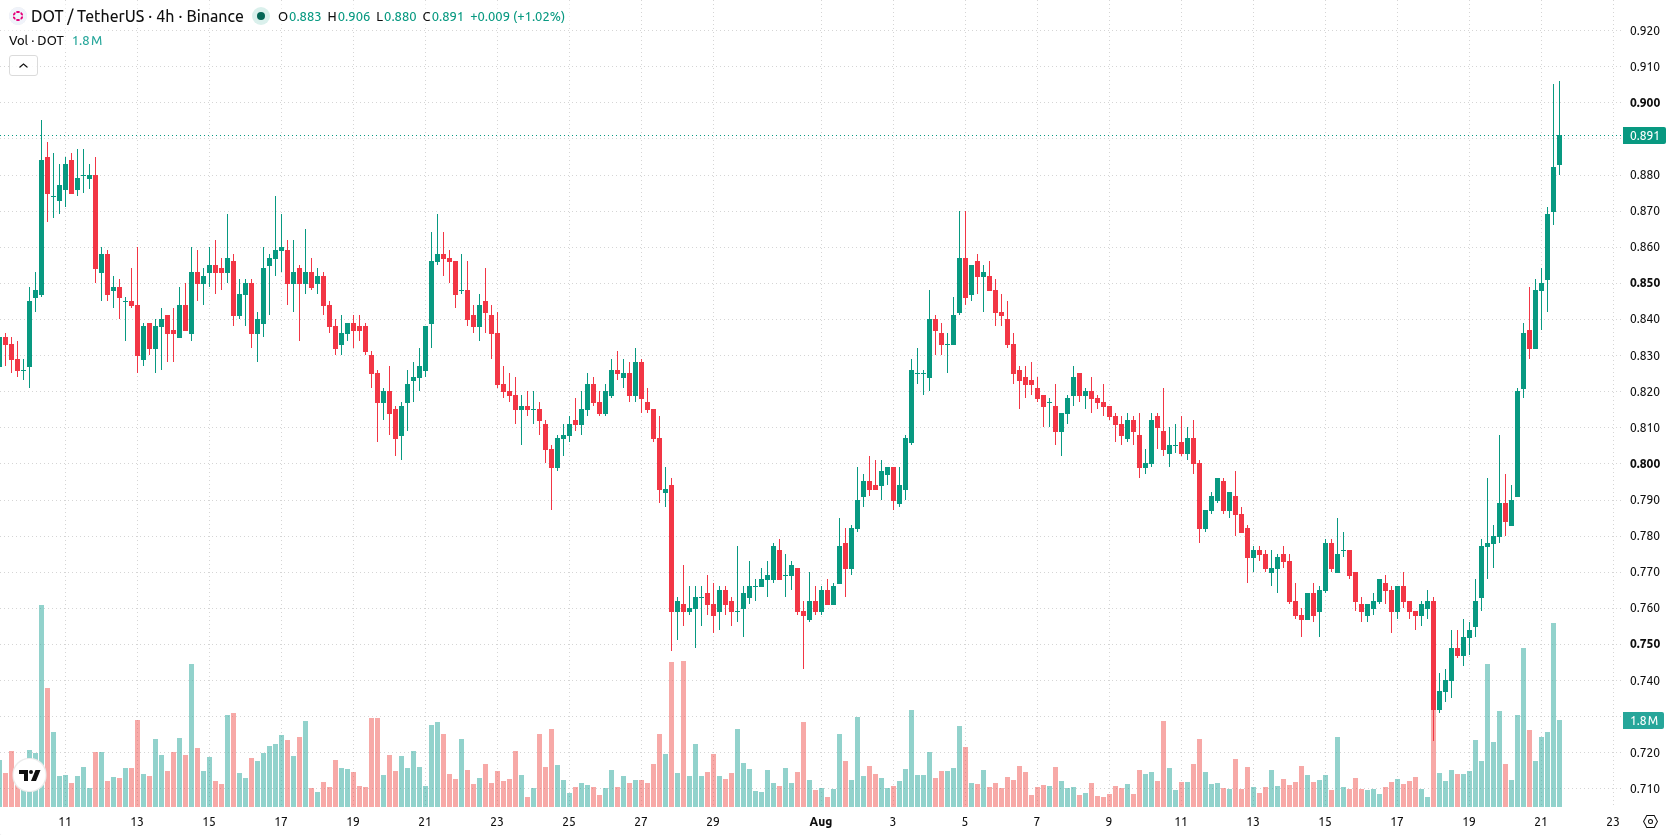
Bullish bias holds above averages with conflicting momentum signals
DOT/USD trades above the 20-day and 50-day moving averages ($0.797 and $0.818), reinforcing a short- and medium-term bullish structure. The price remains below the 200-day moving average ($1.149), signaling longer-term pressure, with immediate focus on resistance at the near-term ceiling of $0.905 and support at the near-term floor at $0.851. Momentum signals are mixed. The MACD projects a strong sell, and the Average Directional Index (ADX) at 17.75 is neutral, suggesting the uptrend is not firmly established. The Relative Strength Index (RSI) at 60.736 and Commodity Channel Index (CCI) at 76.519 signal mild bullish momentum, while the Stochastic RSI is at 100, indicating extreme overbought conditions. Bull/Bear Power (BBP) is positive at 0.061, showing intraday buyers dominate, though the setup is overbought. The daily move is $0.894, a gain of $0.056 or 6.68% in an up session. DOT/USD opened with an upside gap of about 1.19% and is trading near the session high. Intraday volatility stands at 8.12%. Momentum and oscillator readings remain divergent, even as the overall tone is strong toward session highs.
Earlier, analysts noted that Polkadot’s short-term outlook was skewed bullish amid changing tokenomics and increased developer activity. The current analysis broadens this view by highlighting divergent momentum signals and overbought conditions, with traders advised to monitor the $0.905 resistance level as a potential trigger for a renewed advance.










-
 Afghanistan
-
 Albania
-
 Algeria
-
 Angola
-
 Argentina
-
 Armenia
-
 Australia
-
 Austria
-
 Azerbaijan
-
 Bahamas
-
 Bahrain
-
 Bangladesh
-
 Belarus
-
 Belgium
-
 Bolivia
-
 Botswana
-
 Brazil
-
 Brunei
-
 Bulgaria
-
 Cambodia
-
 Cameroon
-
 Canada
-
 Chile
Chile
-
 China
China
-
 Colombia
-
 Congo
Congo
-
 Costa Rica
-
 Cote d'Ivoire
-
 Croatia
-
 Cuba
Cuba
-
 Cyprus
-
 Czechia
-
 DR Congo
-
 Denmark
-
 Dominican Republic
-
 Ecuador
-
 Egypt
Egypt
-
 El Salvador
-
 Estonia
-
 Eswatini
-
 Ethiopia
-
 Finland
-
 France
-
 Georgia
-
 Germany
-
 Ghana
Ghana
-
 Greece
-
 Haiti
Haiti
-
 Hong Kong
-
 Hungary
-
 India
India
-
 Indonesia
-
 Iran, Islamic republic
-
 Iraq
Iraq
-
 Ireland
-
 Israel
-
 Italy
Italy
-
 Jamaica
-
 Japan
Japan
-
 Jordan
-
 Kazakhstan
-
 Kenya
Kenya
-
 Korea
Korea
-
 Kuwait
-
 Kyrgyzstan
-
 Laos
Laos
-
 Latvia
-
 Lebanon
-
 Lesotho
-
 Libya
Libya
-
 Lithuania
-
 Luxembourg
-
 Madagascar
-
 Malaysia
-
 Malta
Malta
-
 Mauritius
-
 Mexico
-
 Moldova
-
 Mongolia
-
 Montenegro
-
 Morocco
-
 Mozambique
-
 Myanmar
-
 Namibia
-
 Nepal
Nepal
-
 Netherlands
-
 New Zealand
-
 Nigeria
-
 North Macedonia
-
 Norway
-
 Oman
Oman
-
 Pakistan
-
 Palestine
-
 Panama
-
 Papua New Guinea
-
 Paraguay
-
 Peru
Peru
-
 Philippines
-
 Poland
-
 Portugal
-
 Puerto Rico
-
 Qatar
Qatar
-
 Reunion
-
 Romania
-
 Rwanda
-
 Saudi Arabia
-
 Serbia
-
 Singapore
-
 Slovakia
-
 Slovenia
-
 Somalia
-
 South Africa
-
 Spain
Spain
-
 Sri Lanka
-
 Sweden
-
 Switzerland
-
 Syria
Syria
-
 Taiwan
-
 Tajikistan
-
 Tanzania
-
 Thailand
-
 Trinidad and Tobago
-
 Tunisia
-
 Turkey
-
 UAE
UAE
-
 Uganda
-
 Ukraine
-
 United Kingdom
-
United States
-
 Uruguay
-
 Uzbekistan
-
 Venezuela
-
 Vietnam
-
 Yemen
Yemen
-
 Zambia
-
 Zimbabwe
- Forex
- Crypto












