

VeChain price forecast: Short-term rally signals further upside potential

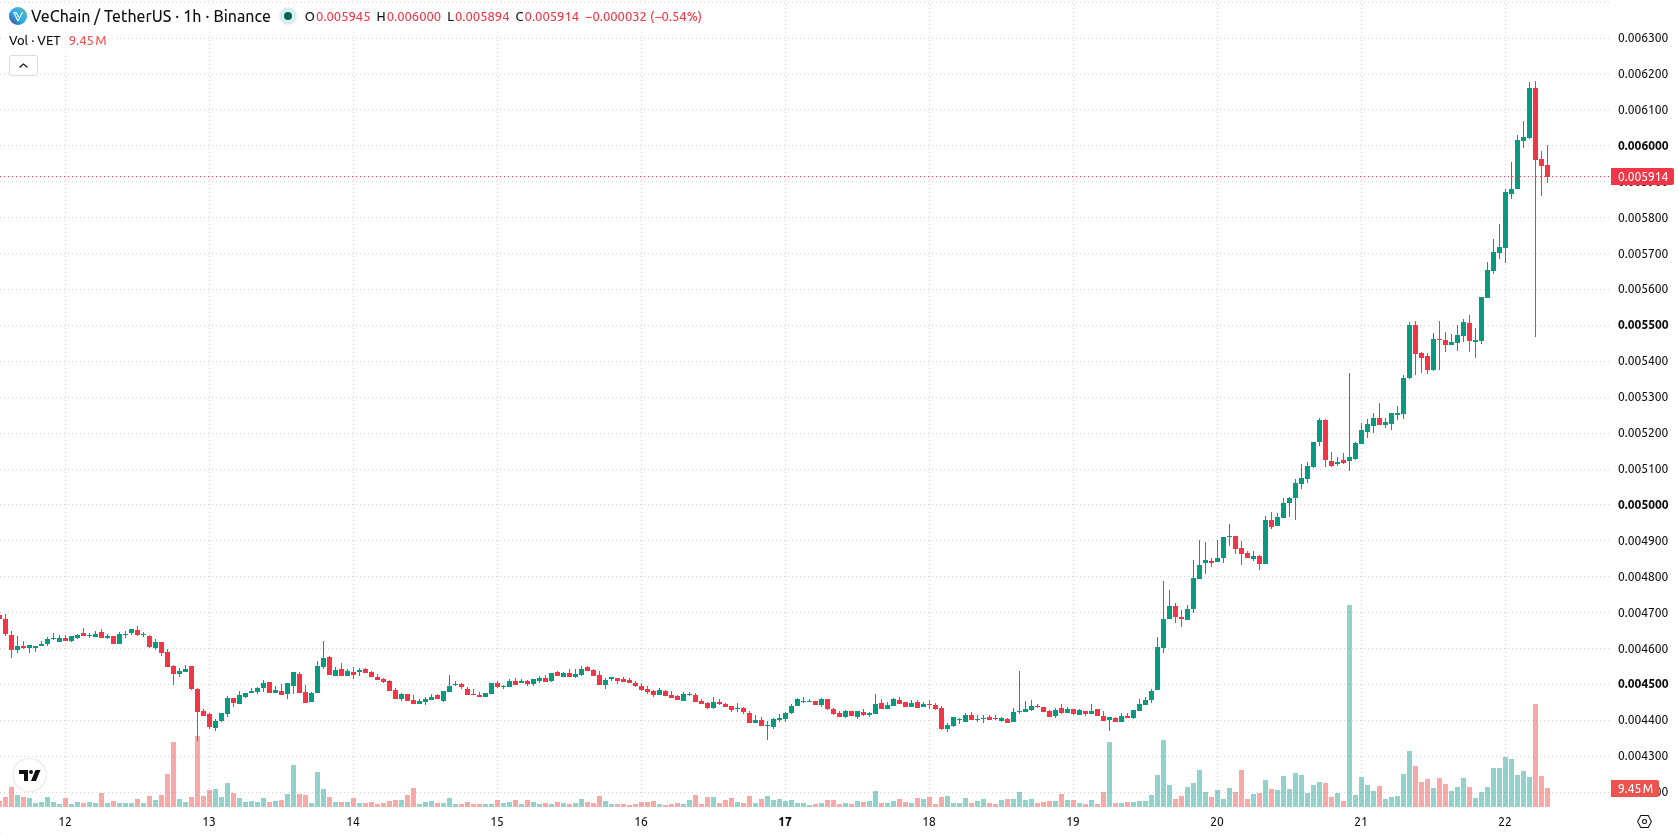
VeChain (VET) is trading at $0.005922 after a 10.86% daily gain. The price currently sits above its key short-term moving averages, indicating active intraday momentum compared to recent sessions.
 0.00808
0.00888000
0.00808
0.00888000
Highlights
- VET/USD trades above short-term moving averages but remains below its daily long-term average, indicating mixed momentum with ongoing seller pressure.
- Both MACD and ADX support firm buy signals while oscillators are mostly bullish, though some indicators show divergence warranting caution.
- VET/USD rose 10.86% to $0.005922 with high volatility and is expected to consolidate between $0.00560068 to $0.00624332 over the next 2 to 3 days.
Mixed oscillator signals as buy momentum meets resistance
On the hourly chart, VET/USD trades above the MA-20 and MA-50, while still below the daily MA-200. The Ichimoku Kijun provides immediate support at $0.005708. Both MACD and ADX signal firm intraday buy conditions, and Bull/Bear Power highlights clear buyer dominance for short-term action. RSI and CCI remain in buy territory, but the Stochastic RSI is oversold, creating a divergence that signals the potential for further gains, although some oscillators are not entirely aligned with the prevailing move.
Volatility band holds as upside bias outweighs downside risk
Looking ahead to the next 2–3 trading days, price action is likely to consolidate in a band between $0.00560068 and $0.00624332, with a strong probability of an upward move and low probability of a drop. The most typical scenario is sideways movement within the established volatility band, although a breakout above resistance could signal additional upside, while a break below immediate support at $0.005708 would open up room for a bearish correction.
Earlier, analysts noted that VeChain’s technical setup suggested a likely period of consolidation following a sharp rally, as market participants awaited confirmation of further direction. The current move above key short-term averages, despite mixed oscillator signals, strengthens the case for watching potential upside risk if price convincingly breaks through the established resistance zone.










-
 Afghanistan
-
 Albania
-
 Algeria
-
 Angola
-
 Argentina
-
 Armenia
-
 Australia
-
 Austria
-
 Azerbaijan
-
 Bahamas
-
 Bahrain
-
 Bangladesh
-
 Belarus
-
 Belgium
-
 Bolivia
-
 Botswana
-
 Brazil
-
 Brunei
-
 Bulgaria
-
 Cambodia
-
 Cameroon
-
 Canada
-
 Chile
Chile
-
 China
China
-
 Colombia
-
 Congo
Congo
-
 Costa Rica
-
 Cote d'Ivoire
-
 Croatia
-
 Cuba
Cuba
-
 Cyprus
-
 Czechia
-
 DR Congo
-
 Denmark
-
 Dominican Republic
-
 Ecuador
-
 Egypt
Egypt
-
 El Salvador
-
 Estonia
-
 Eswatini
-
 Ethiopia
-
 Finland
-
 France
-
 Georgia
-
 Germany
-
 Ghana
Ghana
-
 Greece
-
 Haiti
Haiti
-
 Hong Kong
-
 Hungary
-
 India
India
-
 Indonesia
-
 Iran, Islamic republic
-
 Iraq
Iraq
-
 Ireland
-
 Israel
-
 Italy
Italy
-
 Jamaica
-
 Japan
Japan
-
 Jordan
-
 Kazakhstan
-
 Kenya
Kenya
-
 Korea
Korea
-
 Kuwait
-
 Kyrgyzstan
-
 Laos
Laos
-
 Latvia
-
 Lebanon
-
 Lesotho
-
 Libya
Libya
-
 Lithuania
-
 Luxembourg
-
 Madagascar
-
 Malaysia
-
 Malta
Malta
-
 Mauritius
-
 Mexico
-
 Moldova
-
 Mongolia
-
 Montenegro
-
 Morocco
-
 Mozambique
-
 Myanmar
-
 Namibia
-
 Nepal
Nepal
-
 Netherlands
-
 New Zealand
-
 Nigeria
-
 North Macedonia
-
 Norway
-
 Oman
Oman
-
 Pakistan
-
 Palestine
-
 Panama
-
 Papua New Guinea
-
 Paraguay
-
 Peru
Peru
-
 Philippines
-
 Poland
-
 Portugal
-
 Puerto Rico
-
 Qatar
Qatar
-
 Reunion
-
 Romania
-
 Rwanda
-
 Saudi Arabia
-
 Serbia
-
 Singapore
-
 Slovakia
-
 Slovenia
-
 Somalia
-
 South Africa
-
 Spain
Spain
-
 Sri Lanka
-
 Sweden
-
 Switzerland
-
 Syria
Syria
-
 Taiwan
-
 Tajikistan
-
 Tanzania
-
 Thailand
-
 Trinidad and Tobago
-
 Tunisia
-
 Turkey
-
 UAE
UAE
-
 Uganda
-
 Ukraine
-
 United Kingdom
-
United States
-
 Uruguay
-
 Uzbekistan
-
 Venezuela
-
 Vietnam
-
 Yemen
Yemen
-
 Zambia
-
 Zimbabwe
- Forex
- Crypto












