

VeChain setup divided as mixed technical signals point to possible short-term rebound: weekly analysis

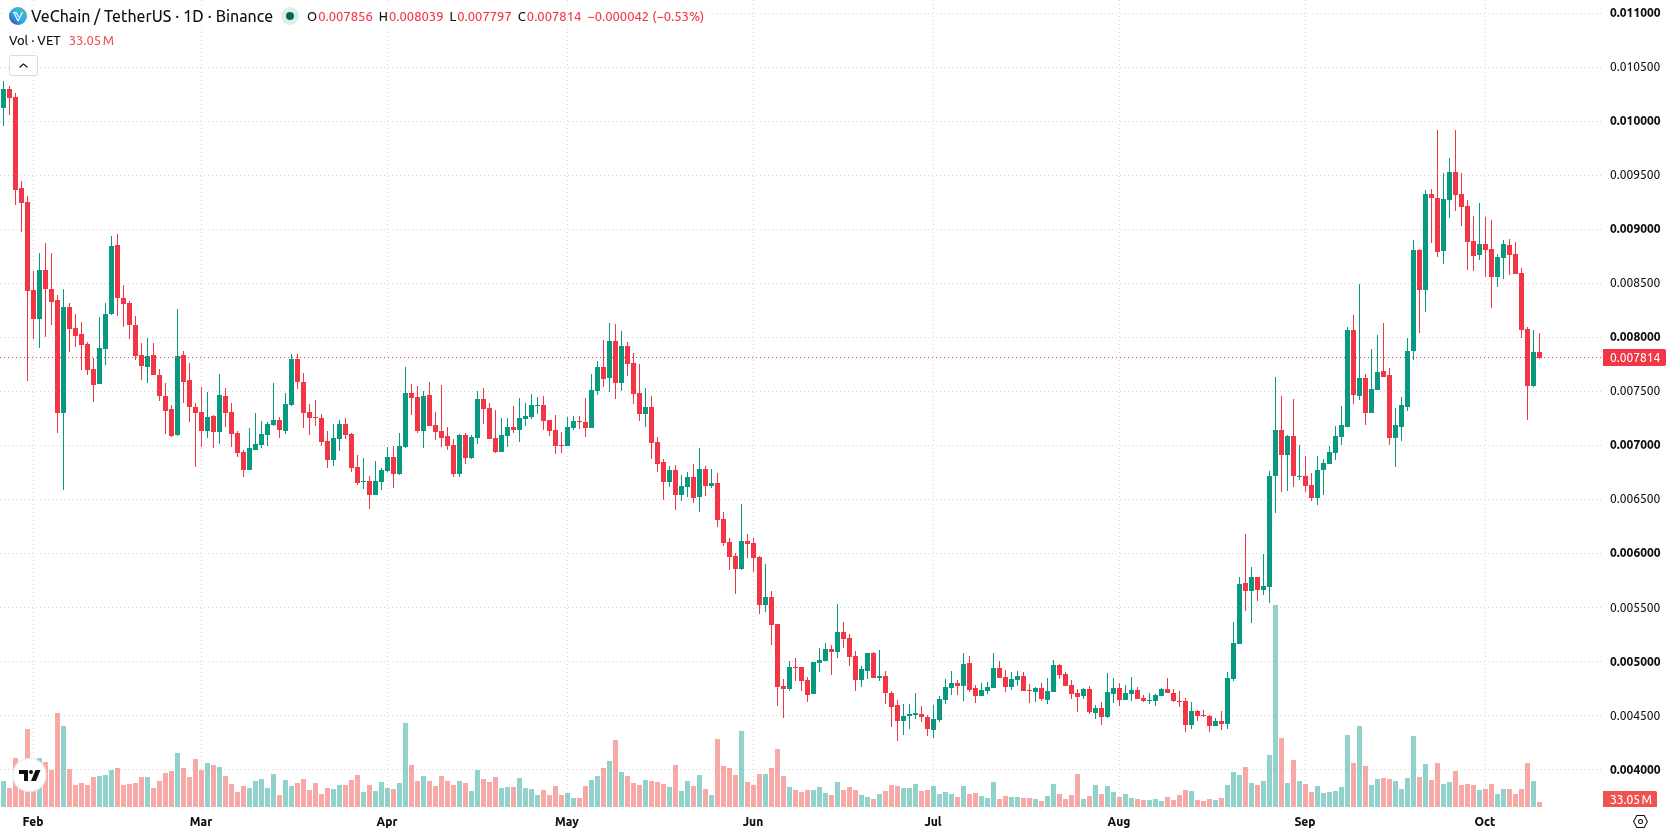
VeChain (VET) is trading near $0.0078 after falling roughly 9% this week, as bears maintain pressure with the setup lodged deep in oversold territory. Momentum has favored sellers, but technical signals are mixed and suggest the market could stabilize or attempt a short-term rebound in the days ahead.
 0.005855
0.00658300
Highlights
- VeChain trades at $0.00781, down 8.74% over seven days, now below its short-term moving average with high volatility.
- Technical indicators show oversold conditions, with the price above long-term support and signals mixed for near-term direction.
- Next week, VeChain is expected to fluctuate between $0.00692314 and $0.008703, with 55% probability of an increase.
Support levels tested as mixed technicals hint at rebound risk
The daily chart shows a sustained move lower with a firm trend, as volatility stays high at 23.18%. Despite price holding above the MA-50, RSI remains neutral at 42.25 while both CCI and Stoch RSI register in oversold territory, suggesting possible exhaustion in the recent decline. The nearest support is the MA-50 at $0.00769394, with initial resistance at the Ichimoku Kijun of $0.008359. This mix of trend and oversold readings leaves the technical signals divided, pointing to possible stabilization or a short-term rebound attempt.
Breakout triggers watched as base case favors consolidation next week
Next week, the expected range is $0.00692314 to $0.008703, with a 55% probability of an increase and a 45% chance of a decrease. The base case anticipates VeChain trading between support at $0.00769394 and resistance at $0.008359. A sustained break above $0.008359 would open the door for further gains toward the top of the range. A move below $0.00769394 would point to deeper weakness and a possible test of the lower end of the expected range.
Earlier, analysts noted that VeChain was experiencing persistent bearish momentum alongside mixed technical signals, with traders focused on potential breakout scenarios. The latest developments add a new dimension by highlighting pronounced oversold conditions and elevated volatility, making the upcoming test of support at $0.00769394 a key level to watch for signs of stabilization or further downside risk.










-
 Afghanistan
-
 Albania
-
 Algeria
-
 Angola
-
 Argentina
-
 Armenia
-
 Australia
-
 Austria
-
 Azerbaijan
-
 Bahamas
-
 Bahrain
-
 Bangladesh
-
 Belarus
-
 Belgium
-
 Bolivia
-
 Botswana
-
 Brazil
-
 Brunei
-
 Bulgaria
-
 Cambodia
-
 Cameroon
-
 Canada
-
 Chile
-
 China
-
 Colombia
-
 Congo
-
 Costa Rica
-
 Cote d'Ivoire
-
 Croatia
-
 Cuba
-
 Cyprus
-
 Czechia
-
 DR Congo
-
 Denmark
-
 Dominican Republic
-
 Ecuador
-
 Egypt
-
 El Salvador
-
 Estonia
-
 Eswatini
-
 Ethiopia
-
 Finland
-
 France
-
 Georgia
-
 Germany
-
 Ghana
-
 Greece
-
 Haiti
-
 Hong Kong
-
 Hungary
-
 India
-
 Indonesia
-
 Iran, Islamic republic
-
 Iraq
-
 Ireland
-
 Israel
-
 Italy
-
 Jamaica
-
 Japan
-
 Jordan
-
 Kazakhstan
-
 Kenya
-
 Korea
-
 Kuwait
-
 Kyrgyzstan
-
 Laos
-
 Latvia
-
 Lebanon
-
 Lesotho
-
 Libya
-
 Lithuania
-
 Luxembourg
-
 Madagascar
-
 Malaysia
-
 Malta
-
 Mauritius
-
 Mexico
-
 Moldova
-
 Mongolia
-
 Montenegro
-
 Morocco
-
 Mozambique
-
 Myanmar
-
 Namibia
-
 Nepal
-
 Netherlands
-
 New Zealand
-
 Nigeria
-
 North Macedonia
-
 Norway
-
 Oman
-
 Pakistan
-
 Palestine
-
 Panama
-
 Papua New Guinea
-
 Paraguay
-
 Peru
-
 Philippines
-
 Poland
-
 Portugal
-
 Puerto Rico
-
 Qatar
-
 Reunion
-
 Romania
-
 Rwanda
-
 Saudi Arabia
-
 Serbia
-
 Singapore
-
 Slovakia
-
 Slovenia
-
 Somalia
-
 South Africa
-
 Spain
-
 Sri Lanka
-
 Sweden
-
 Switzerland
-
 Syria
-
 Taiwan
-
 Tajikistan
-
 Tanzania
-
 Thailand
-
 Trinidad and Tobago
-
 Tunisia
-
 Turkey
-
 UAE
-
 Uganda
-
 Ukraine
-
 United Kingdom
-
United States
-
 Uruguay
-
 Uzbekistan
-
 Venezuela
-
 Vietnam
-
 Yemen
-
 Zambia
-
 Zimbabwe
- Forex
- Crypto












