

The Graph climbs around 15% as bulls test upper range boundaries: weekly analysis

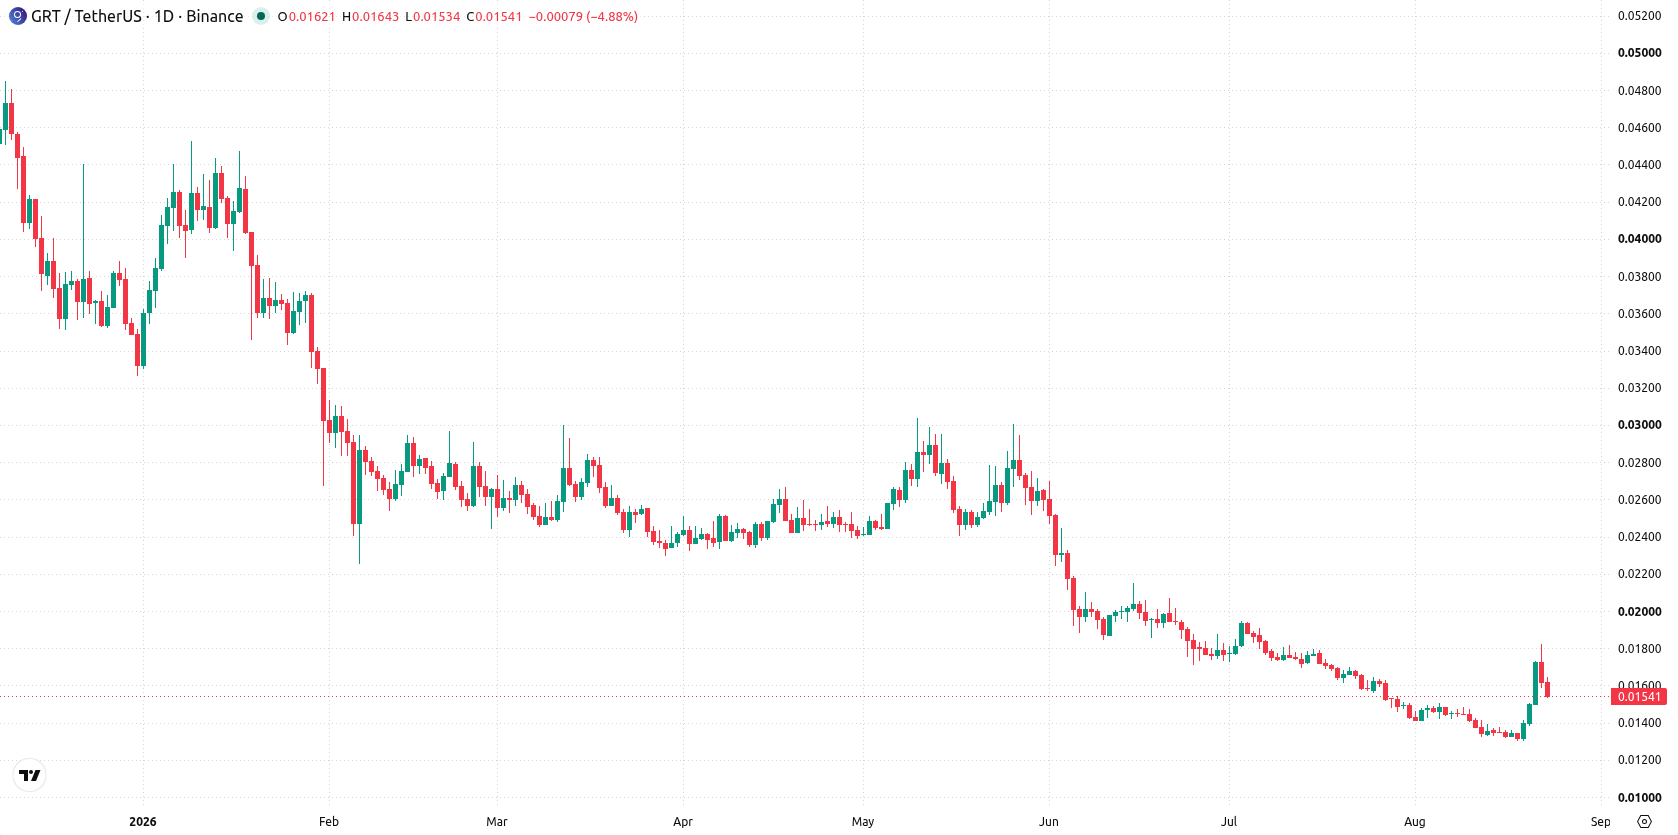
The Graph (GRT) is trading near $0.015, after buyers pushed prices up around 15% over the past week. The chart setup highlights strong upside momentum but warns that technical indicators are approaching stretched levels. This week, traders are watching closely to see if bullish pressure can extend further or if overbought conditions trigger a pause.
 0.01623
0.01898000
Highlights
- The Graph is trading at $0.01543, up 14.87% over the past 7 days, remaining in a recovery phase within a broader bearish trend.
- Short-term momentum is stretched as indicators register overbought conditions, suggesting limited immediate upside potential without a corrective move.
- The price is expected to trade between $0.01266254 and $0.01819745, with key resistance at $0.015605 and support at $0.0143645.
Stretched indicators over the week as momentum trend extends
On the daily chart, momentum character shows a sustained move higher with a firm trend, supported by a 40.26% weekly volatility. RSI is at 68.5104713 and approaching overbought, while CCI is firmly in the overbought zone at 256.46947914, highlighting stretched short-term momentum. The nearest support is at $0.0143645, and immediate resistance is at $0.015605, defined by the Ichimoku Kijun. The overbought momentum alongside a trending structure suggests potential for further upside, but signals caution against chasing strength at current levels.
Sideways bias next week as range top resistance limits gains
For the next 7 days, the expected range is $0.01266254 to $0.01819745, with a 57% probability of an increase and 43% probability of a decrease. The base case is continuation inside this band, with resistance at $0.015605 likely capping immediate advances. A close above this level could open room toward the upper boundary at $0.01819745. Should the price fall below support at $0.0143645, downside risk increases toward the lower boundary at $0.01266254.
Earlier, analysts noted that The Graph was demonstrating persistent bullish momentum despite mixed technical signals. The current analysis expands on this by highlighting that while upside potential remains, traders should monitor the $0.015605 resistance as a decisive level for the next move.











-
 Afghanistan
-
 Albania
-
 Algeria
-
 Angola
-
 Argentina
-
 Armenia
-
 Australia
-
 Austria
-
 Azerbaijan
-
 Bahamas
-
 Bahrain
-
 Bangladesh
-
 Belarus
-
 Belgium
-
 Bolivia
-
 Botswana
-
 Brazil
-
 Brunei
-
 Bulgaria
-
 Cambodia
-
 Cameroon
-
 Canada
-
 Chile
-
 China
-
 Colombia
-
 Congo
-
 Costa Rica
-
 Cote d'Ivoire
-
 Croatia
-
 Cuba
-
 Cyprus
-
 Czechia
-
 DR Congo
-
 Denmark
-
 Dominican Republic
-
 Ecuador
-
 Egypt
-
 El Salvador
-
 Estonia
-
 Eswatini
-
 Ethiopia
-
 Finland
-
 France
-
 Georgia
-
 Germany
-
 Ghana
-
 Greece
-
 Haiti
-
 Hong Kong
-
 Hungary
-
 India
-
 Indonesia
-
 Iran, Islamic republic
-
 Iraq
-
 Ireland
-
 Israel
-
 Italy
-
 Jamaica
-
 Japan
-
 Jordan
-
 Kazakhstan
-
 Kenya
-
 Korea
-
 Kuwait
-
 Kyrgyzstan
-
 Laos
-
 Latvia
-
 Lebanon
-
 Lesotho
-
 Libya
-
 Lithuania
-
 Luxembourg
-
 Madagascar
-
 Malaysia
-
 Malta
-
 Mauritius
-
 Mexico
-
 Moldova
-
 Mongolia
-
 Montenegro
-
 Morocco
-
 Mozambique
-
 Myanmar
-
 Namibia
-
 Nepal
-
 Netherlands
-
 New Zealand
-
 Nigeria
-
 North Macedonia
-
 Norway
-
 Oman
-
 Pakistan
-
 Palestine
-
 Panama
-
 Papua New Guinea
-
 Paraguay
-
 Peru
-
 Philippines
-
 Poland
-
 Portugal
-
 Puerto Rico
-
 Qatar
-
 Reunion
-
 Romania
-
 Rwanda
-
 Saudi Arabia
-
 Serbia
-
 Singapore
-
 Slovakia
-
 Slovenia
-
 Somalia
-
 South Africa
-
 Spain
-
 Sri Lanka
-
 Sweden
-
 Switzerland
-
 Syria
-
 Taiwan
-
 Tajikistan
-
 Tanzania
-
 Thailand
-
 Trinidad and Tobago
-
 Tunisia
-
 Turkey
-
 UAE
-
 Uganda
-
 Ukraine
-
 United Kingdom
-
United States
-
 Uruguay
-
 Uzbekistan
-
 Venezuela
-
 Vietnam
-
 Yemen
-
 Zambia
-
 Zimbabwe
- Forex
- Crypto












