

Support pressure at $85.73: Can SOL avoid deeper losses?

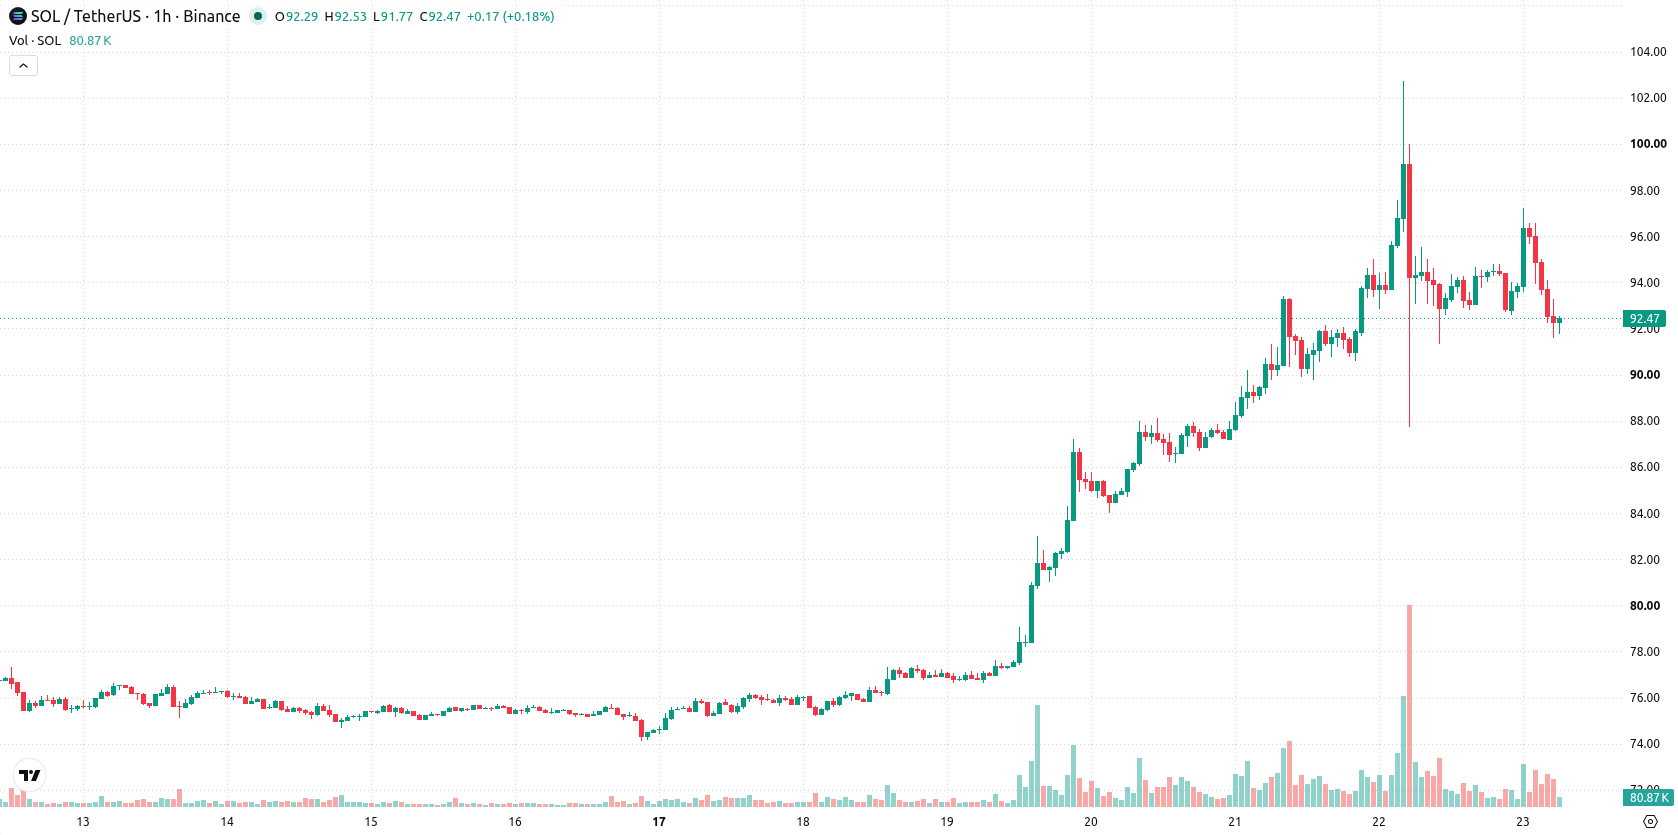
Solana (SOL) is trading at $92.06, marking a decline of 1.92% for the day as the asset remains below its key moving averages on short and medium-term charts while holding above longer-term support.
 113.4
122.00
113.4
122.00
Highlights
- Solana-linked ETFs, including SOLZ and BSOL, attracted $2.06 million and over $20 million in inflows respectively in the week ending August 20, 2026.
- Solana governance will open a validator vote on resource-based fee burning and accelerated inflation reduction proposals on August 23, 2026.
- SOL/USD trades with short- and medium-term bearish signals, with support at $85.73 and resistance at $95.23 within a $85.73 to $98.39 range over the next two to three sessions.
ETF inflows and governance shifts as institutional demand diverges from price
Solana-linked ETFs, including SOLZ, recorded $2.06 million in inflows on August 20, 2026, reflecting ongoing institutional allocations to the asset via regulated investment vehicles, according to Tipranks. This period also saw the Bitwise Solana staking ETF (BSOL) post over $20 million in weekly inflows, as reported by Cryptorank, supporting interest from large-scale investors in both staking and spot market products. Governance developments continue as Solana moves toward a validator vote on resource-based fee burning and accelerated inflation reduction proposals, opening August 23, 2026, according to Bitcoinist. Cathie Wood's ARK Invest expanded its exposure through additional purchases of a Solana staking ETF, while Techbullion reported $10.26 million in net spot ETF inflows for the week prior, though price action has remained under broader selling pressure.
Mixed momentum signals as sellers challenge near-term resistance
On the hourly chart, SOL trades below both the MA-20 and MA-50, indicating near-term resistance, while it remains above the MA-200 on the daily timeframe, suggesting structural long-term support. The immediate resistance is defined by the Ichimoku Kijun at $95.23. Among momentum indicators, MACD issues a strong buy signal, whereas ADX points to a sell. RSI is within the sell zone, with both Stoch RSI and CCI also oversold, highlighting potential for a technical bounce. However, Bull/Bear Power confirms sellers dominate the intraday session with high volatility.
Sideways movement favored as breakout hinges on resistance
In the short term, SOL is expected to trade within a $85.73 to $98.39 volatility band relative to current levels. The base case calls for sideways movement within this corridor. There is a 55% probability assigned to an upward move, contingent on a sustained break above $95.23 resistance. The downside scenario, rated at 45% likelihood, would activate if support near $85.73 fails.
Earlier, analysts noted that Solana’s price outlook was shaped by recent technical upgrades and key governance initiatives, highlighting both growing network capabilities and the importance of leadership decisions. The current analysis expands on this by incorporating notable ETF inflows and evolving governance proposals, emphasizing the need for traders to monitor whether SOL can reclaim the pivotal $95.23 resistance for potential upside continuation.










-
 Afghanistan
-
 Albania
-
 Algeria
-
 Angola
-
 Argentina
-
 Armenia
-
 Australia
-
 Austria
-
 Azerbaijan
-
 Bahamas
-
 Bahrain
-
 Bangladesh
-
 Belarus
-
 Belgium
-
 Bolivia
-
 Botswana
-
 Brazil
-
 Brunei
-
 Bulgaria
-
 Cambodia
-
 Cameroon
-
 Canada
-
 Chile
Chile
-
 China
China
-
 Colombia
-
 Congo
Congo
-
 Costa Rica
-
 Cote d'Ivoire
-
 Croatia
-
 Cuba
Cuba
-
 Cyprus
-
 Czechia
-
 DR Congo
-
 Denmark
-
 Dominican Republic
-
 Ecuador
-
 Egypt
Egypt
-
 El Salvador
-
 Estonia
-
 Eswatini
-
 Ethiopia
-
 Finland
-
 France
-
 Georgia
-
 Germany
-
 Ghana
Ghana
-
 Greece
-
 Haiti
Haiti
-
 Hong Kong
-
 Hungary
-
 India
India
-
 Indonesia
-
 Iran, Islamic republic
-
 Iraq
Iraq
-
 Ireland
-
 Israel
-
 Italy
Italy
-
 Jamaica
-
 Japan
Japan
-
 Jordan
-
 Kazakhstan
-
 Kenya
Kenya
-
 Korea
Korea
-
 Kuwait
-
 Kyrgyzstan
-
 Laos
Laos
-
 Latvia
-
 Lebanon
-
 Lesotho
-
 Libya
Libya
-
 Lithuania
-
 Luxembourg
-
 Madagascar
-
 Malaysia
-
 Malta
Malta
-
 Mauritius
-
 Mexico
-
 Moldova
-
 Mongolia
-
 Montenegro
-
 Morocco
-
 Mozambique
-
 Myanmar
-
 Namibia
-
 Nepal
Nepal
-
 Netherlands
-
 New Zealand
-
 Nigeria
-
 North Macedonia
-
 Norway
-
 Oman
Oman
-
 Pakistan
-
 Palestine
-
 Panama
-
 Papua New Guinea
-
 Paraguay
-
 Peru
Peru
-
 Philippines
-
 Poland
-
 Portugal
-
 Puerto Rico
-
 Qatar
Qatar
-
 Reunion
-
 Romania
-
 Rwanda
-
 Saudi Arabia
-
 Serbia
-
 Singapore
-
 Slovakia
-
 Slovenia
-
 Somalia
-
 South Africa
-
 Spain
Spain
-
 Sri Lanka
-
 Sweden
-
 Switzerland
-
 Syria
Syria
-
 Taiwan
-
 Tajikistan
-
 Tanzania
-
 Thailand
-
 Trinidad and Tobago
-
 Tunisia
-
 Turkey
-
 UAE
UAE
-
 Uganda
-
 Ukraine
-
 United Kingdom
-
United States
-
 Uruguay
-
 Uzbekistan
-
 Venezuela
-
 Vietnam
-
 Yemen
Yemen
-
 Zambia
-
 Zimbabwe
- Forex
- Crypto












