

Can Solana break $95.81 resistance after governance votes clarify policy direction?

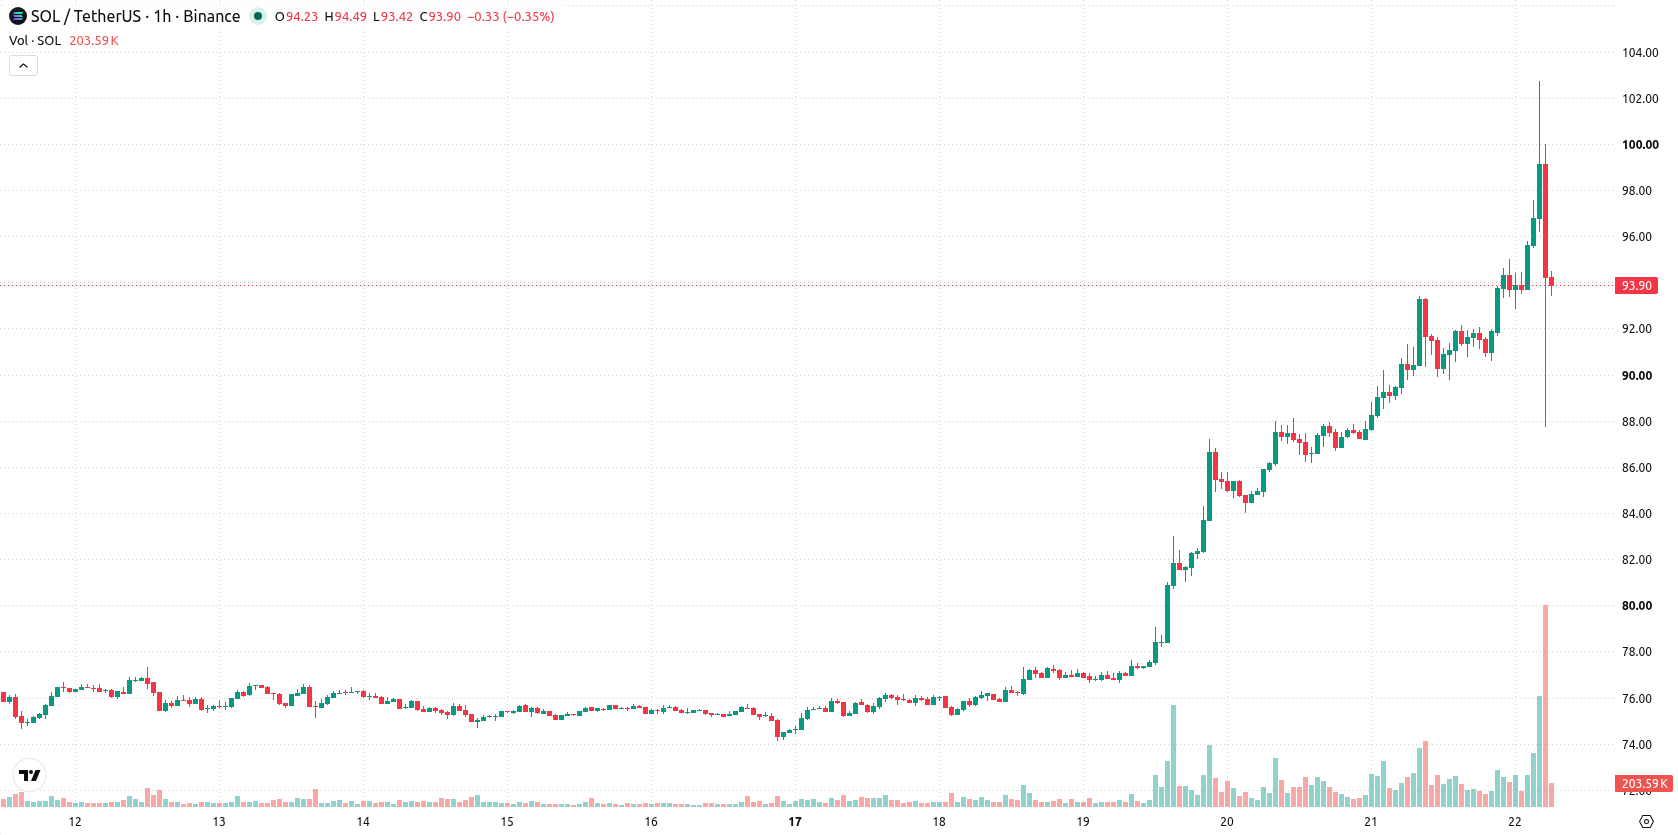
Solana (SOL) is trading at $93.92, up 3.46% on the day. The price sits above its key moving averages, highlighting a firm stance in both short- and long-term technical setups.
 109.07
116.81
109.07
116.81
Highlights
- Solana reduced blockchain slot times to 350 milliseconds, directly increasing throughput and lowering transaction latency for users and developers.
- Solana Company announced support for Solana Constitution SGP-0001 and opposition to economic changes SGP-0002 and SGP-0003, with voting set for August 22.
- SOL/USD trades in a bullish range with a projected 2 to 3 day corridor of $89.25 to $98.59 and an estimated 70% chance of further gains.
Network speed upgrades and governance clarity fuel renewed ecosystem confidence
Solana has implemented a blockchain slot time reduction to 350 milliseconds for the first time, a move that directly increases network throughput and decreases transaction latency, making the protocol more attractive for users and developers, according to Cointelegraph. This technical enhancement is expected to boost network activity and reinforce demand for the SOL token as immediate performance metrics improve. Alongside this, Solana Company (NASDAQ: HSDT) recently announced its positions on key governance proposals, supporting the Solana Constitution (SGP-0001) while opposing economic changes SGP-0002 and SGP-0003, with voting due to begin August 22 as reported by Quiverquant. Together, these developments clarify the direction of both Solana's technical and governance reforms, supporting growing confidence in its ecosystem.
Bullish momentum faces overbought risks amid diverging oscillator signals
On the hourly chart, SOL is positioned above the MA-20 at $93.14 and MA-50 at $90.05, while on the daily timeframe, it is well above the MA-200 at $81.25. Immediate resistance emerges from the Ichimoku Kijun at $95.81, with the MA-200 providing longer-term support. Among momentum indicators, both MACD and ADX are bullish, and RSI reads 67.78, confirming near-term buying interest. However, CCI and Bull/Bear Power reflect overbought conditions, while Stoch RSI signals a strong sell, suggesting buyers may be losing momentum. The Awesome Oscillator continues to indicate upward pressure, but significant intraday volatility highlights a divergence between momentum and overbought oscillators.
Upside favored as volatility shapes near-term price band
In the short term, SOL is expected to fluctuate within a band of $89.25 to $98.59, reflecting the prevailing volatility relative to current levels. There is a 70% probability of an upward move, making further gains more likely, while a decline has a 30% probability. If the price breaks above immediate resistance at $95.81, the bullish scenario envisions a test of new highs. Conversely, a move below $89.25 would indicate increased seller pressure and may point to a bearish reversal.
Earlier, analysts noted that Solana’s bullish momentum was underpinned by institutional interest, strong inflows, and ongoing network upgrades. The current assessment adds a new dimension with both technical enhancements and governance developments, highlighting $95.81 as a pivotal resistance level that could determine near-term direction.





Latest Solana News






-
 Afghanistan
-
 Albania
-
 Algeria
-
 Angola
-
 Argentina
-
 Armenia
-
 Australia
-
 Austria
-
 Azerbaijan
-
 Bahamas
-
 Bahrain
-
 Bangladesh
-
 Belarus
-
 Belgium
-
 Bolivia
-
 Botswana
-
 Brazil
-
 Brunei
-
 Bulgaria
-
 Cambodia
-
 Cameroon
-
 Canada
-
 Chile
Chile
-
 China
China
-
 Colombia
-
 Congo
Congo
-
 Costa Rica
-
 Cote d'Ivoire
-
 Croatia
-
 Cuba
Cuba
-
 Cyprus
-
 Czechia
-
 DR Congo
-
 Denmark
-
 Dominican Republic
-
 Ecuador
-
 Egypt
Egypt
-
 El Salvador
-
 Estonia
-
 Eswatini
-
 Ethiopia
-
 Finland
-
 France
-
 Georgia
-
 Germany
-
 Ghana
Ghana
-
 Greece
-
 Haiti
Haiti
-
 Hong Kong
-
 Hungary
-
 India
India
-
 Indonesia
-
 Iran, Islamic republic
-
 Iraq
Iraq
-
 Ireland
-
 Israel
-
 Italy
Italy
-
 Jamaica
-
 Japan
Japan
-
 Jordan
-
 Kazakhstan
-
 Kenya
Kenya
-
 Korea
Korea
-
 Kuwait
-
 Kyrgyzstan
-
 Laos
Laos
-
 Latvia
-
 Lebanon
-
 Lesotho
-
 Libya
Libya
-
 Lithuania
-
 Luxembourg
-
 Madagascar
-
 Malaysia
-
 Malta
Malta
-
 Mauritius
-
 Mexico
-
 Moldova
-
 Mongolia
-
 Montenegro
-
 Morocco
-
 Mozambique
-
 Myanmar
-
 Namibia
-
 Nepal
Nepal
-
 Netherlands
-
 New Zealand
-
 Nigeria
-
 North Macedonia
-
 Norway
-
 Oman
Oman
-
 Pakistan
-
 Palestine
-
 Panama
-
 Papua New Guinea
-
 Paraguay
-
 Peru
Peru
-
 Philippines
-
 Poland
-
 Portugal
-
 Puerto Rico
-
 Qatar
Qatar
-
 Reunion
-
 Romania
-
 Rwanda
-
 Saudi Arabia
-
 Serbia
-
 Singapore
-
 Slovakia
-
 Slovenia
-
 Somalia
-
 South Africa
-
 Spain
Spain
-
 Sri Lanka
-
 Sweden
-
 Switzerland
-
 Syria
Syria
-
 Taiwan
-
 Tajikistan
-
 Tanzania
-
 Thailand
-
 Trinidad and Tobago
-
 Tunisia
-
 Turkey
-
 UAE
UAE
-
 Uganda
-
 Ukraine
-
 United Kingdom
-
United States
-
 Uruguay
-
 Uzbekistan
-
 Venezuela
-
 Vietnam
-
 Yemen
Yemen
-
 Zambia
-
 Zimbabwe
- Forex
- Crypto












