

The Graph gains about 11.5% after short- and medium-term technical indicators improve

The Graph (GRT) surged 11.47% as short- and medium-term technical momentum brought buyers back into the market. The rally looks limited, with the price yet to reclaim its 200-day moving average and several oscillators signaling overbought conditions.
 0.01623
0.01898000
Highlights
- GRT/USD trades above short- and medium-term moving averages but remains below the longer-term 200-day average, indicating short-term strength within a broader bearish trend.
- Momentum readings are mixed, with both sustained buying strength and multiple overbought signals, suggesting possible near-term exhaustion and divergence among technical indicators.
- The expected five-day range is $0.014685 to $0.02204, with current support at $0.01703 and resistance at $0.01766; a close above resistance may open room to test the upper forecast range.
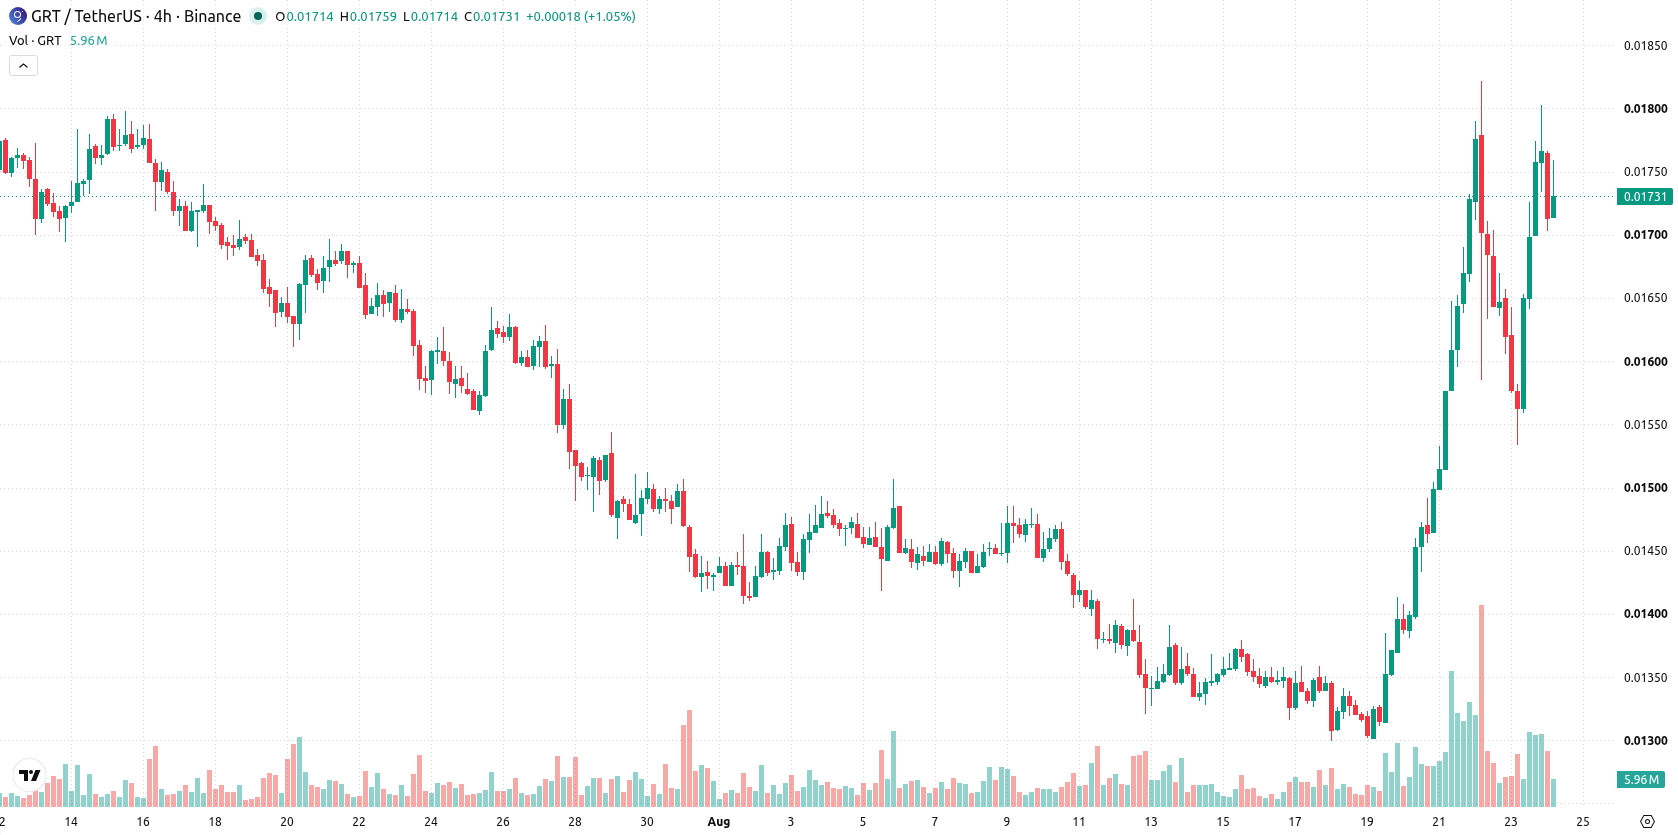
Short-term bullish bias as mixed momentum meets major resistance
GRT/USD is trading above its 20-day and 50-day moving averages at $0.0145955 and $0.0156588, but remains below the 200-day at $0.02219255. This setup signals strength in the short and medium term, though the longer-term trend remains under bearish overhang. The nearest support level is at $0.01703 and resistance stands at $0.01766, which frame the trading range. Momentum signals are mixed: the MACD is neutral, while ADX and RSI point to sustained buying strength, with the RSI at 63.67 indicating that there is room before extreme overbought conditions occur. However, the Stochastic RSI and CCI are both overbought, warning of potential exhaustion. The BBP value above zero confirms buyers are in control intraday, and the Awesome Oscillator supports this bullish tone. Intraday volatility is 3.70%.
Earlier, analysts noted that The Graph exhibited mixed technical momentum, with bullish short-term signals tempered by persistent longer-term bearish pressures. The latest market action strengthens this view and underscores that a decisive break above $0.01766 remains critical for a sustained trend shift.











-
 Afghanistan
-
 Albania
-
 Algeria
-
 Angola
-
 Argentina
-
 Armenia
-
 Australia
-
 Austria
-
 Azerbaijan
-
 Bahamas
-
 Bahrain
-
 Bangladesh
-
 Belarus
-
 Belgium
-
 Bolivia
-
 Botswana
-
 Brazil
-
 Brunei
-
 Bulgaria
-
 Cambodia
-
 Cameroon
-
 Canada
-
 Chile
-
 China
-
 Colombia
-
 Congo
-
 Costa Rica
-
 Cote d'Ivoire
-
 Croatia
-
 Cuba
-
 Cyprus
-
 Czechia
-
 DR Congo
-
 Denmark
-
 Dominican Republic
-
 Ecuador
-
 Egypt
-
 El Salvador
-
 Estonia
-
 Eswatini
-
 Ethiopia
-
 Finland
-
 France
-
 Georgia
-
 Germany
-
 Ghana
-
 Greece
-
 Haiti
-
 Hong Kong
-
 Hungary
-
 India
-
 Indonesia
-
 Iran, Islamic republic
-
 Iraq
-
 Ireland
-
 Israel
-
 Italy
-
 Jamaica
-
 Japan
-
 Jordan
-
 Kazakhstan
-
 Kenya
-
 Korea
-
 Kuwait
-
 Kyrgyzstan
-
 Laos
-
 Latvia
-
 Lebanon
-
 Lesotho
-
 Libya
-
 Lithuania
-
 Luxembourg
-
 Madagascar
-
 Malaysia
-
 Malta
-
 Mauritius
-
 Mexico
-
 Moldova
-
 Mongolia
-
 Montenegro
-
 Morocco
-
 Mozambique
-
 Myanmar
-
 Namibia
-
 Nepal
-
 Netherlands
-
 New Zealand
-
 Nigeria
-
 North Macedonia
-
 Norway
-
 Oman
-
 Pakistan
-
 Palestine
-
 Panama
-
 Papua New Guinea
-
 Paraguay
-
 Peru
-
 Philippines
-
 Poland
-
 Portugal
-
 Puerto Rico
-
 Qatar
-
 Reunion
-
 Romania
-
 Rwanda
-
 Saudi Arabia
-
 Serbia
-
 Singapore
-
 Slovakia
-
 Slovenia
-
 Somalia
-
 South Africa
-
 Spain
-
 Sri Lanka
-
 Sweden
-
 Switzerland
-
 Syria
-
 Taiwan
-
 Tajikistan
-
 Tanzania
-
 Thailand
-
 Trinidad and Tobago
-
 Tunisia
-
 Turkey
-
 UAE
-
 Uganda
-
 Ukraine
-
 United Kingdom
-
United States
-
 Uruguay
-
 Uzbekistan
-
 Venezuela
-
 Vietnam
-
 Yemen
-
 Zambia
-
 Zimbabwe
- Forex
- Crypto












