

Can The Graph avoid deeper losses as bearish momentum limits breakout chances?

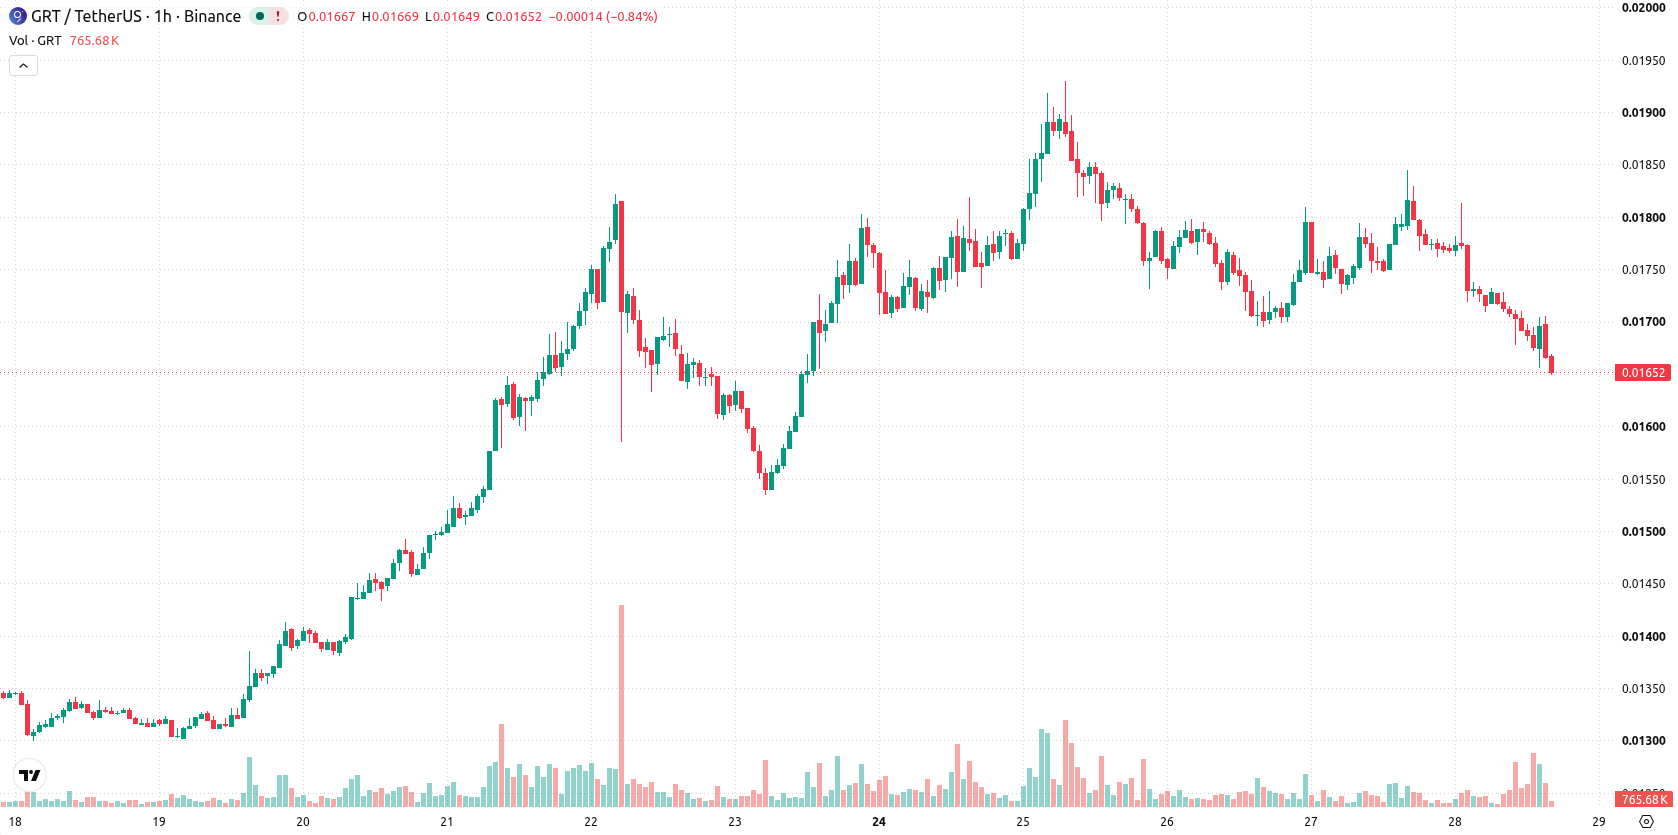
The Graph (GRT) is trading at $0.01661, posting a daily decline of 7.52%. The asset is currently positioned below its main moving averages as selling pressure dominates short-term direction.
 0.02473
0.02585000
Highlights
- GRT/USD trades well below key moving averages in short, medium, and long timeframes, confirming entrenched bearish momentum.
- Momentum indicators such as RSI, MACD, and Bull/Bear Power show seller dominance, with most readings negative and trend oscillators neutral.
- Expected price range for the next 2 to 3 days is $0.01572452 to $0.01789, with a high probability of further declines unless $0.017505 resistance is breached.
Bearish momentum builds amid diverging indicator signals
GRT is trading below the MA-20 and MA-50 levels on the hourly chart, and remains well under the MA-200 on the daily timeframe. The Ichimoku Kijun at $0.017505 serves as an immediate resistance level. Momentum indicators are mostly bearish: RSI, CCI, MACD, and Bull/Bear Power all point to seller dominance, while ADX and Stochastic RSI present more neutral signals. There is a notable divergence between strong sell signals and the neutral stance of some momentum oscillators.
Downside risk prevails with tight trading corridor expected
Over the next 2–3 trading days, GRT is anticipated to fluctuate within a band of $0.01572452 to $0.01789. The likelihood of an upward breakout is very low, with downside risk predominating. The baseline expectation is for sideways movement inside this established corridor; a break above the $0.017505 resistance could ignite a short-term rebound, whereas a sustained move below support would suggest further declines in price.
Earlier, analysts noted that The Graph had shifted from a period of sustained downside momentum to a short-term bullish technical outlook. The current analysis signals a return to bearish dominance, highlighting $0.017505 as a critical resistance level for any potential reversal in price action.










-
 Afghanistan
-
 Albania
-
 Algeria
-
 Angola
-
 Argentina
-
 Armenia
-
 Australia
-
 Austria
-
 Azerbaijan
-
 Bahamas
-
 Bahrain
-
 Bangladesh
-
 Belarus
-
 Belgium
-
 Bolivia
-
 Botswana
-
 Brazil
-
 Brunei
-
 Bulgaria
-
 Cambodia
-
 Cameroon
-
 Canada
-
 Chile
-
 China
-
 Colombia
-
 Congo
-
 Costa Rica
-
 Cote d'Ivoire
-
 Croatia
-
 Cuba
-
 Cyprus
-
 Czechia
-
 DR Congo
-
 Denmark
-
 Dominican Republic
-
 Ecuador
-
 Egypt
-
 El Salvador
-
 Estonia
-
 Eswatini
-
 Ethiopia
-
 Finland
-
 France
-
 Georgia
-
 Germany
-
 Ghana
-
 Greece
-
 Haiti
-
 Hong Kong
-
 Hungary
-
 India
-
 Indonesia
-
 Iran, Islamic republic
-
 Iraq
-
 Ireland
-
 Israel
-
 Italy
-
 Jamaica
-
 Japan
-
 Jordan
-
 Kazakhstan
-
 Kenya
-
 Korea
-
 Kuwait
-
 Kyrgyzstan
-
 Laos
-
 Latvia
-
 Lebanon
-
 Lesotho
-
 Libya
-
 Lithuania
-
 Luxembourg
-
 Madagascar
-
 Malaysia
-
 Malta
-
 Mauritius
-
 Mexico
-
 Moldova
-
 Mongolia
-
 Montenegro
-
 Morocco
-
 Mozambique
-
 Myanmar
-
 Namibia
-
 Nepal
-
 Netherlands
-
 New Zealand
-
 Nigeria
-
 North Macedonia
-
 Norway
-
 Oman
-
 Pakistan
-
 Palestine
-
 Panama
-
 Papua New Guinea
-
 Paraguay
-
 Peru
-
 Philippines
-
 Poland
-
 Portugal
-
 Puerto Rico
-
 Qatar
-
 Reunion
-
 Romania
-
 Rwanda
-
 Saudi Arabia
-
 Serbia
-
 Singapore
-
 Slovakia
-
 Slovenia
-
 Somalia
-
 South Africa
-
 Spain
-
 Sri Lanka
-
 Sweden
-
 Switzerland
-
 Syria
-
 Taiwan
-
 Tajikistan
-
 Tanzania
-
 Thailand
-
 Trinidad and Tobago
-
 Tunisia
-
 Turkey
-
 UAE
-
 Uganda
-
 Ukraine
-
 United Kingdom
-
United States
-
 Uruguay
-
 Uzbekistan
-
 Venezuela
-
 Vietnam
-
 Yemen
-
 Zambia
-
 Zimbabwe
- Forex
- Crypto












