

The Graph rally gains traction as short-term trend favors buyers

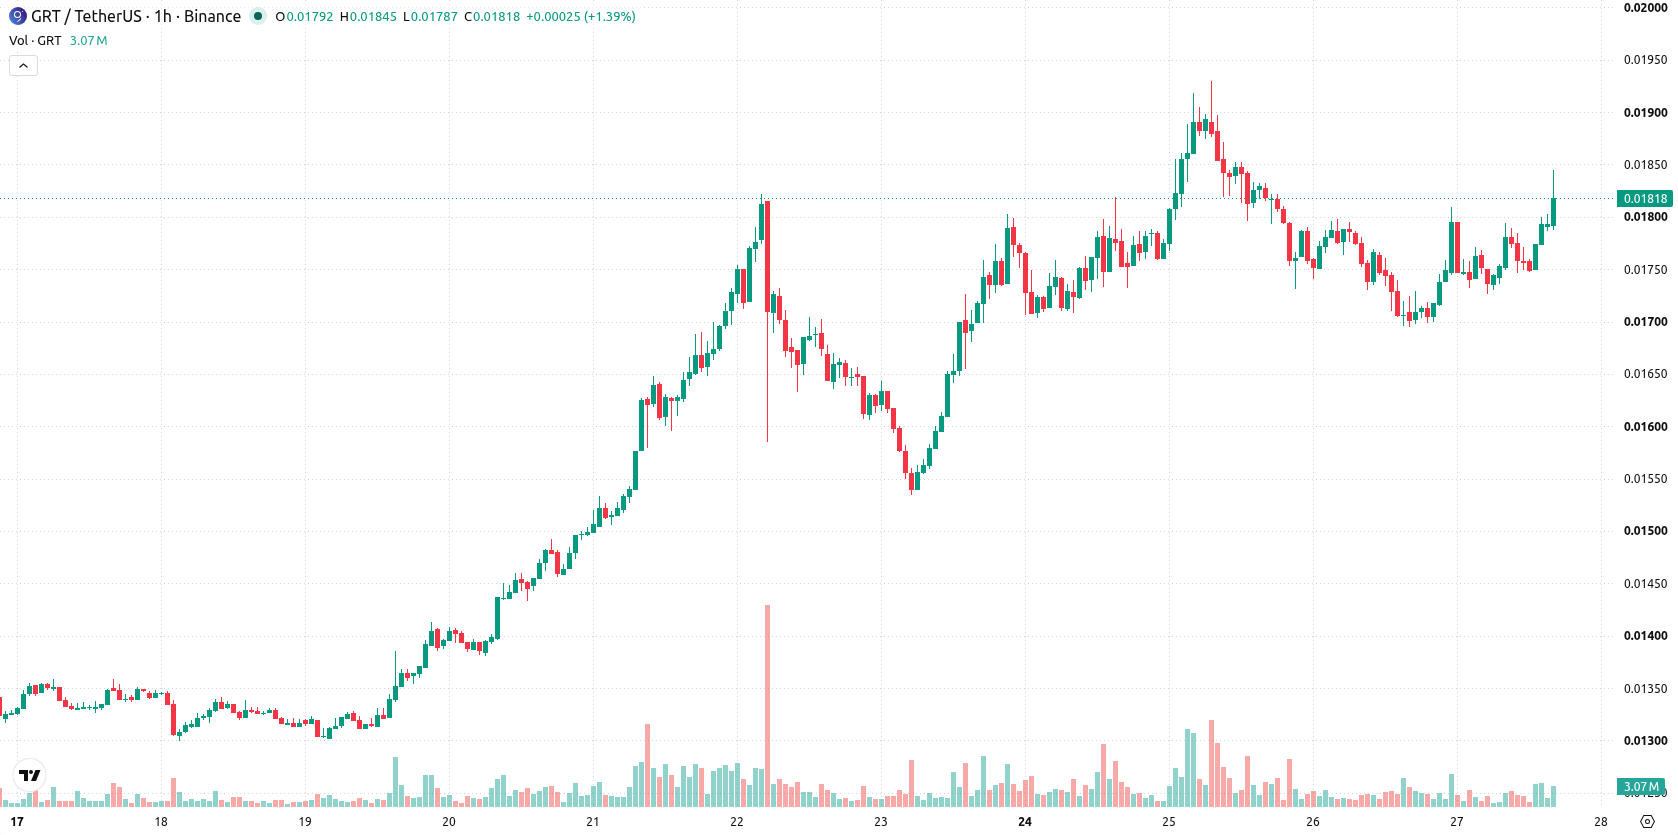
The Graph (GRT) is trading at $0.01822, up 6.99% on the day. The price is currently above its key short- and medium-term moving averages, but remains below its longer-term benchmarks.
 0.02669
0.02844000
0.02669
0.02844000
Highlights
- GRT/USD trades above short- and medium-term moving averages but remains below the long-term trend indicator, showing mixed momentum.
- Technical signals show strong buyer presence intraday, though overbought momentum indicators signal potential for a short-term pause or retracement.
- Forecast range for the next 2 to 3 trading days is $0.01725625 to $0.02026, with a very high probability of an upward move.
Technical momentum strengthens as overbought indicators flag caution
On the technical front, GRT is positioned above the MA-20 and MA-50 on the h1 timeframe, but continues to trade below the long-term MA-200 (daily). Immediate support is marked by the Ichimoku Kijun at $0.01752. MACD signals a buy, while ADX indicates neutral momentum. The RSI stands at 60.7, a buy reading, but both Stoch RSI and CCI are in overbought territory, which may highlight short-term exhaustion. Bull/Bear Power favors buyers during the intraday session, supplemented by confirmation from the Awesome Oscillator.
Volatility risk persists as price faces breakout or consolidation
Looking ahead to the next 2–3 trading days, GRT is projected to trade within a range of $0.01725625 to $0.02026, with volatility expected to remain elevated. A consolidation scenario would see the price holding within this corridor. Should GRT break through resistance, further gains toward the upper end of the range are possible. Conversely, a drop below immediate support could prompt a move toward the lower end of the forecast band, though this is considered very unlikely in the near term.
Earlier, analysts noted that The Graph was experiencing sustained downside momentum amid high volatility, with technical signals indicating a strong selling presence. The current technical landscape signals a shift to short-term bullishness, and traders should watch for a potential breakout above $0.02026 as the next significant resistance.











-
 Afghanistan
-
 Albania
-
 Algeria
-
 Angola
-
 Argentina
-
 Armenia
-
 Australia
-
 Austria
-
 Azerbaijan
-
 Bahamas
-
 Bahrain
-
 Bangladesh
-
 Belarus
-
 Belgium
-
 Bolivia
-
 Botswana
-
 Brazil
-
 Brunei
-
 Bulgaria
-
 Cambodia
-
 Cameroon
-
 Canada
-
 Chile
Chile
-
 China
China
-
 Colombia
-
 Congo
Congo
-
 Costa Rica
-
 Cote d'Ivoire
-
 Croatia
-
 Cuba
Cuba
-
 Cyprus
-
 Czechia
-
 DR Congo
-
 Denmark
-
 Dominican Republic
-
 Ecuador
-
 Egypt
Egypt
-
 El Salvador
-
 Estonia
-
 Eswatini
-
 Ethiopia
-
 Finland
-
 France
-
 Georgia
-
 Germany
-
 Ghana
Ghana
-
 Greece
-
 Haiti
Haiti
-
 Hong Kong
-
 Hungary
-
 India
India
-
 Indonesia
-
 Iran, Islamic republic
-
 Iraq
Iraq
-
 Ireland
-
 Israel
-
 Italy
Italy
-
 Jamaica
-
 Japan
Japan
-
 Jordan
-
 Kazakhstan
-
 Kenya
Kenya
-
 Korea
Korea
-
 Kuwait
-
 Kyrgyzstan
-
 Laos
Laos
-
 Latvia
-
 Lebanon
-
 Lesotho
-
 Libya
Libya
-
 Lithuania
-
 Luxembourg
-
 Madagascar
-
 Malaysia
-
 Malta
Malta
-
 Mauritius
-
 Mexico
-
 Moldova
-
 Mongolia
-
 Montenegro
-
 Morocco
-
 Mozambique
-
 Myanmar
-
 Namibia
-
 Nepal
Nepal
-
 Netherlands
-
 New Zealand
-
 Nigeria
-
 North Macedonia
-
 Norway
-
 Oman
Oman
-
 Pakistan
-
 Palestine
-
 Panama
-
 Papua New Guinea
-
 Paraguay
-
 Peru
Peru
-
 Philippines
-
 Poland
-
 Portugal
-
 Puerto Rico
-
 Qatar
Qatar
-
 Reunion
-
 Romania
-
 Rwanda
-
 Saudi Arabia
-
 Serbia
-
 Singapore
-
 Slovakia
-
 Slovenia
-
 Somalia
-
 South Africa
-
 Spain
Spain
-
 Sri Lanka
-
 Sweden
-
 Switzerland
-
 Syria
Syria
-
 Taiwan
-
 Tajikistan
-
 Tanzania
-
 Thailand
-
 Trinidad and Tobago
-
 Tunisia
-
 Turkey
-
 UAE
UAE
-
 Uganda
-
 Ukraine
-
 United Kingdom
-
United States
-
 Uruguay
-
 Uzbekistan
-
 Venezuela
-
 Vietnam
-
 Yemen
Yemen
-
 Zambia
-
 Zimbabwe
- Forex
- Crypto












