

The Graph technical analysis: Pullback continues after failed reversal attempt

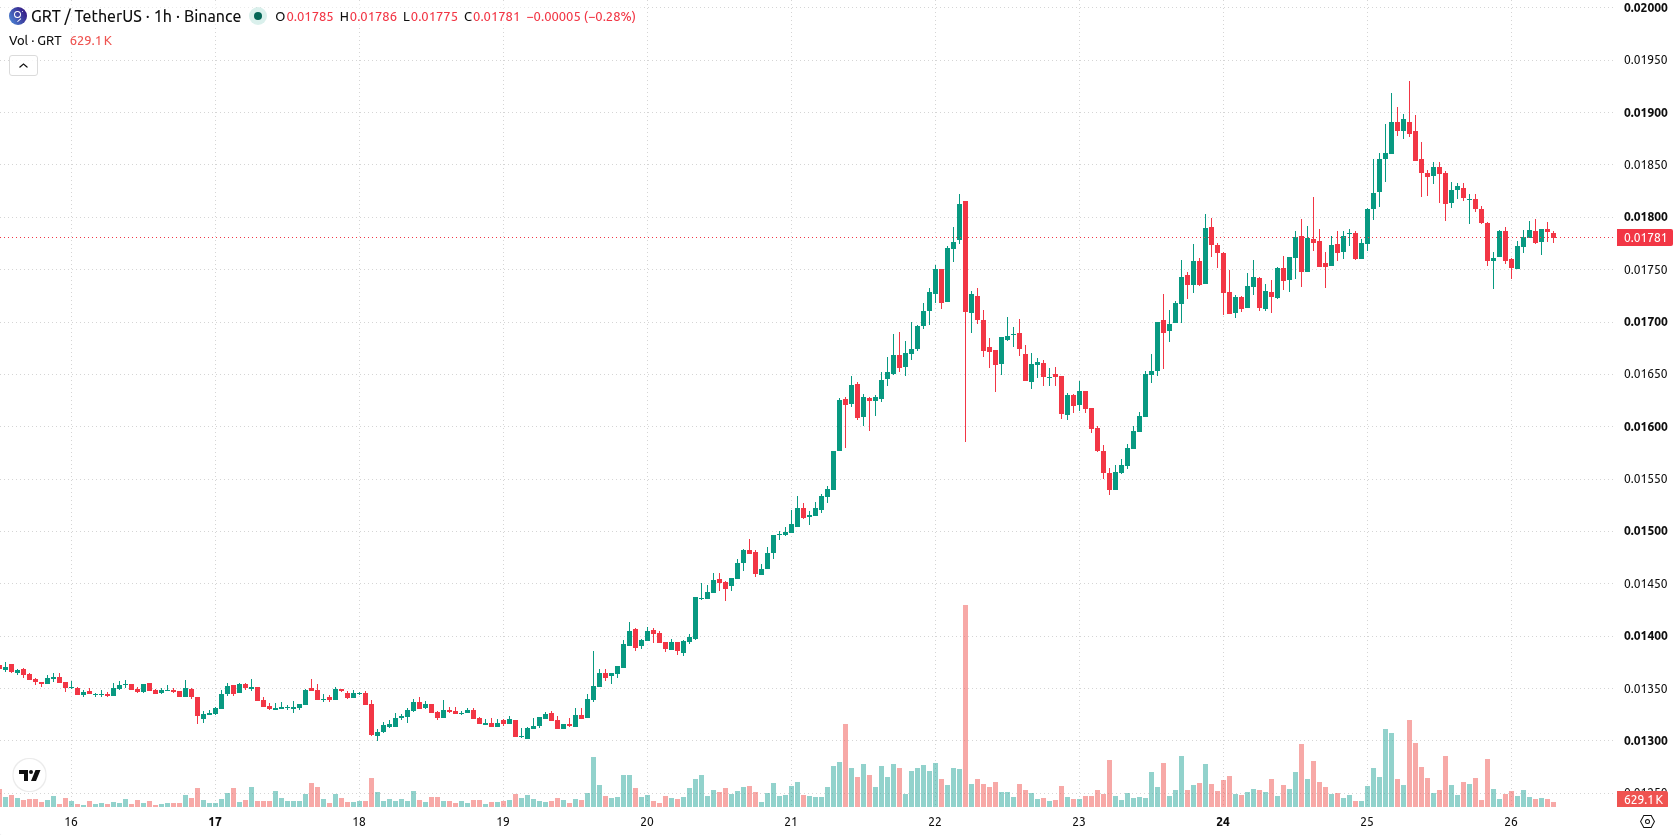
The Graph (GRT) is trading at $0.01775 after a sharp 7.26% drop today. The price is positioned below its key moving averages, signaling sustained downside momentum within a high-volatility environment.
 0.02443
0.02821000
0.02443
0.02821000
Highlights
- GRT/USD trades below all key moving averages in short-, medium-, and long-term timeframes, confirming persistent downside pressure.
- Oscillator-based indicators and selling momentum, with stretched oversold conditions, could limit further downside in the immediate term.
- Expected trading range for the next 2 to 3 days is $0.0165224 to $0.0189776, with 61% odds favoring an upside move.
Selling dominance extended as multiple signals confirm oversold stretch
GRT trades below the MA-20, MA-50, and MA-200, with persistent downside pressure seen across the short-, medium-, and long-term trend indicators. The immediate resistance is defined by the Ichimoku Kijun at $0.018305. MACD and ADX both indicate selling momentum, while RSI issues a sell signal. Both Stoch RSI and CCI remain in oversold territory, suggesting notably stretched conditions. Bull/Bear Power confirms sellers dominating intraday action, and the Awesome Oscillator reinforces the ongoing downward move.
Sideways consolidation expected as breakout risks remain balanced
Over the next 2–3 trading days, GRT is anticipated to trade between $0.0165224 and $0.0189776, a typical volatility band relative to current levels. The probability for an upward move stands at 61%, with a less likely bearish scenario at 39%. The baseline forecast expects the price to consolidate in a sideways pattern within this range. A bullish scenario would require a break above the Ichimoku resistance, while a bearish extension would see price action dropping below short-term support and entering new lows.
Earlier, analysts noted that The Graph displayed short-term bullish momentum but faced lingering downside risks tied to broader bearish trends and overbought conditions. The latest technical setup signals heightened volatility and sustained selling pressure, with any move above the Ichimoku Kijun serving as a potential catalyst for a shift in direction.











-
 Afghanistan
-
 Albania
-
 Algeria
-
 Angola
-
 Argentina
-
 Armenia
-
 Australia
-
 Austria
-
 Azerbaijan
-
 Bahamas
-
 Bahrain
-
 Bangladesh
-
 Belarus
-
 Belgium
-
 Bolivia
-
 Botswana
-
 Brazil
-
 Brunei
-
 Bulgaria
-
 Cambodia
-
 Cameroon
-
 Canada
-
 Chile
Chile
-
 China
China
-
 Colombia
-
 Congo
Congo
-
 Costa Rica
-
 Cote d'Ivoire
-
 Croatia
-
 Cuba
Cuba
-
 Cyprus
-
 Czechia
-
 DR Congo
-
 Denmark
-
 Dominican Republic
-
 Ecuador
-
 Egypt
Egypt
-
 El Salvador
-
 Estonia
-
 Eswatini
-
 Ethiopia
-
 Finland
-
 France
-
 Georgia
-
 Germany
-
 Ghana
Ghana
-
 Greece
-
 Haiti
Haiti
-
 Hong Kong
-
 Hungary
-
 India
India
-
 Indonesia
-
 Iran, Islamic republic
-
 Iraq
Iraq
-
 Ireland
-
 Israel
-
 Italy
Italy
-
 Jamaica
-
 Japan
Japan
-
 Jordan
-
 Kazakhstan
-
 Kenya
Kenya
-
 Korea
Korea
-
 Kuwait
-
 Kyrgyzstan
-
 Laos
Laos
-
 Latvia
-
 Lebanon
-
 Lesotho
-
 Libya
Libya
-
 Lithuania
-
 Luxembourg
-
 Madagascar
-
 Malaysia
-
 Malta
Malta
-
 Mauritius
-
 Mexico
-
 Moldova
-
 Mongolia
-
 Montenegro
-
 Morocco
-
 Mozambique
-
 Myanmar
-
 Namibia
-
 Nepal
Nepal
-
 Netherlands
-
 New Zealand
-
 Nigeria
-
 North Macedonia
-
 Norway
-
 Oman
Oman
-
 Pakistan
-
 Palestine
-
 Panama
-
 Papua New Guinea
-
 Paraguay
-
 Peru
Peru
-
 Philippines
-
 Poland
-
 Portugal
-
 Puerto Rico
-
 Qatar
Qatar
-
 Reunion
-
 Romania
-
 Rwanda
-
 Saudi Arabia
-
 Serbia
-
 Singapore
-
 Slovakia
-
 Slovenia
-
 Somalia
-
 South Africa
-
 Spain
Spain
-
 Sri Lanka
-
 Sweden
-
 Switzerland
-
 Syria
Syria
-
 Taiwan
-
 Tajikistan
-
 Tanzania
-
 Thailand
-
 Trinidad and Tobago
-
 Tunisia
-
 Turkey
-
 UAE
UAE
-
 Uganda
-
 Ukraine
-
 United Kingdom
-
United States
-
 Uruguay
-
 Uzbekistan
-
 Venezuela
-
 Vietnam
-
 Yemen
Yemen
-
 Zambia
-
 Zimbabwe
- Forex
- Crypto












