


The Graph (GRT) surged 9.81% on strong technical momentum, with persistent buyer strength and pronounced upward price action driving today's move. The rebound looks limited, with GRT still trading below its 200-day moving average, leaving the longer-term trend bearish and highlighting overbought risk.
 0.0244
0.02821000
0.0244
0.02821000
Highlights
- GRT/USD demonstrates strong short- and medium-term upward momentum, trading above key shorter moving averages despite a lingering long-term bearish bias.
- Momentum signals are bullish with persistent buyer dominance, but several oscillators indicate overbought conditions as price action pushes toward session highs.
- Expected five-day range is $0.01621 to $0.02391, with 62% probability of an upward move; key levels are $0.01822 support and $0.01918 resistance.
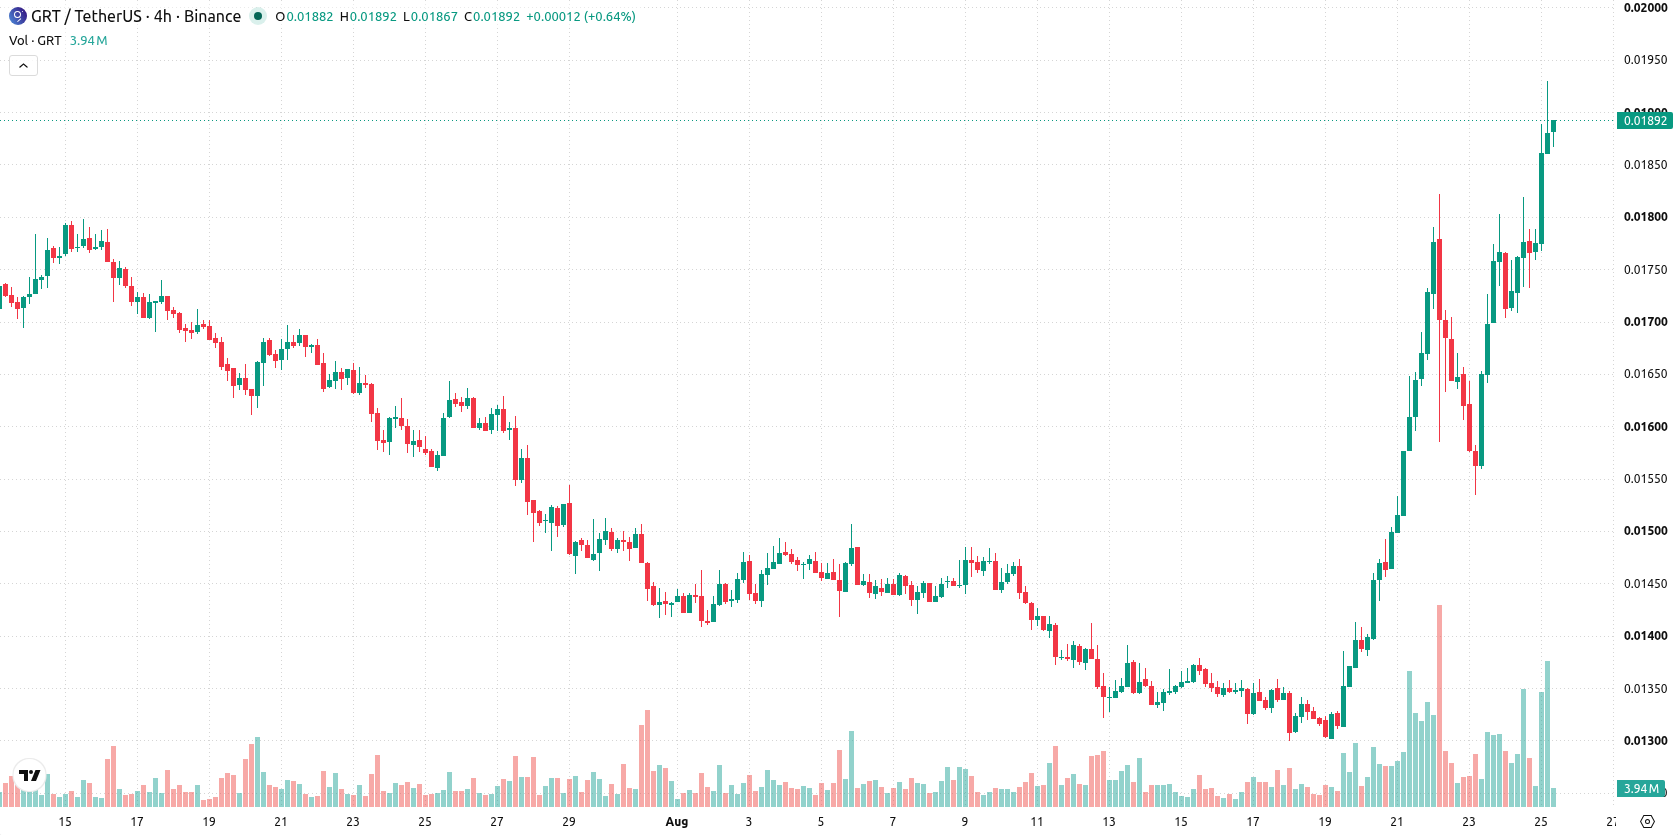
Near-term highs test resistance as bullish momentum nears overbought
GRT/USD is trading above both its 20-day and 50-day moving averages ($0.014781 and $0.0156618), indicating firm short- and medium-term upward momentum. The price remains below the 200-day moving average ($0.02214205), so the long-term trend bias is still bearish. Immediate attention should be on the near-term ceiling at $0.01918, with the $0.01822 level serving as the closest support; distant averages confirm prevailing trend rather than capping the current move. Momentum indicators show persistent buyer strength, with the Moving Average Convergence Divergence (MACD) and Average Directional Index (ADX) both in "Buy" territory. The Relative Strength Index (RSI) is at 69 and Stochastic RSI and Commodity Channel Index (CCI) both flag overbought conditions. Bull/Bear Power (BBP) is positive, confirming intraday buyer dominance, and the Awesome Oscillator (AO) supports this bullish stance. Today's $0.00168 (9.81%) gain features an upside gap of 0.00062 (3.62%), with the price trading near session highs as intraday volatility stands at 8.55%. Price action shows strong direction toward highs, aligning with momentum, but several oscillators now signal stretched conditions.
Earlier, analysts noted that The Graph was exhibiting short-term bullish momentum while still facing longer-term resistance and overbought risks. The latest data reinforces this outlook, with new highs and persistent buyer control emphasizing the importance of monitoring the $0.01918 resistance as a pivot for any breakout or retracement in the days ahead.











-
 Afghanistan
-
 Albania
-
 Algeria
-
 Angola
-
 Argentina
-
 Armenia
-
 Australia
-
 Austria
-
 Azerbaijan
-
 Bahamas
-
 Bahrain
-
 Bangladesh
-
 Belarus
-
 Belgium
-
 Bolivia
-
 Botswana
-
 Brazil
-
 Brunei
-
 Bulgaria
-
 Cambodia
-
 Cameroon
-
 Canada
-
 Chile
Chile
-
 China
China
-
 Colombia
-
 Congo
Congo
-
 Costa Rica
-
 Cote d'Ivoire
-
 Croatia
-
 Cuba
Cuba
-
 Cyprus
-
 Czechia
-
 DR Congo
-
 Denmark
-
 Dominican Republic
-
 Ecuador
-
 Egypt
Egypt
-
 El Salvador
-
 Estonia
-
 Eswatini
-
 Ethiopia
-
 Finland
-
 France
-
 Georgia
-
 Germany
-
 Ghana
Ghana
-
 Greece
-
 Haiti
Haiti
-
 Hong Kong
-
 Hungary
-
 India
India
-
 Indonesia
-
 Iran, Islamic republic
-
 Iraq
Iraq
-
 Ireland
-
 Israel
-
 Italy
Italy
-
 Jamaica
-
 Japan
Japan
-
 Jordan
-
 Kazakhstan
-
 Kenya
Kenya
-
 Korea
Korea
-
 Kuwait
-
 Kyrgyzstan
-
 Laos
Laos
-
 Latvia
-
 Lebanon
-
 Lesotho
-
 Libya
Libya
-
 Lithuania
-
 Luxembourg
-
 Madagascar
-
 Malaysia
-
 Malta
Malta
-
 Mauritius
-
 Mexico
-
 Moldova
-
 Mongolia
-
 Montenegro
-
 Morocco
-
 Mozambique
-
 Myanmar
-
 Namibia
-
 Nepal
Nepal
-
 Netherlands
-
 New Zealand
-
 Nigeria
-
 North Macedonia
-
 Norway
-
 Oman
Oman
-
 Pakistan
-
 Palestine
-
 Panama
-
 Papua New Guinea
-
 Paraguay
-
 Peru
Peru
-
 Philippines
-
 Poland
-
 Portugal
-
 Puerto Rico
-
 Qatar
Qatar
-
 Reunion
-
 Romania
-
 Rwanda
-
 Saudi Arabia
-
 Serbia
-
 Singapore
-
 Slovakia
-
 Slovenia
-
 Somalia
-
 South Africa
-
 Spain
Spain
-
 Sri Lanka
-
 Sweden
-
 Switzerland
-
 Syria
Syria
-
 Taiwan
-
 Tajikistan
-
 Tanzania
-
 Thailand
-
 Trinidad and Tobago
-
 Tunisia
-
 Turkey
-
 UAE
UAE
-
 Uganda
-
 Ukraine
-
 United Kingdom
-
United States
-
 Uruguay
-
 Uzbekistan
-
 Venezuela
-
 Vietnam
-
 Yemen
Yemen
-
 Zambia
-
 Zimbabwe
- Forex
- Crypto












