

Volatility remains elevated with unsettled momentum: Optimism weekly outlook: Can OP attract new buyers?

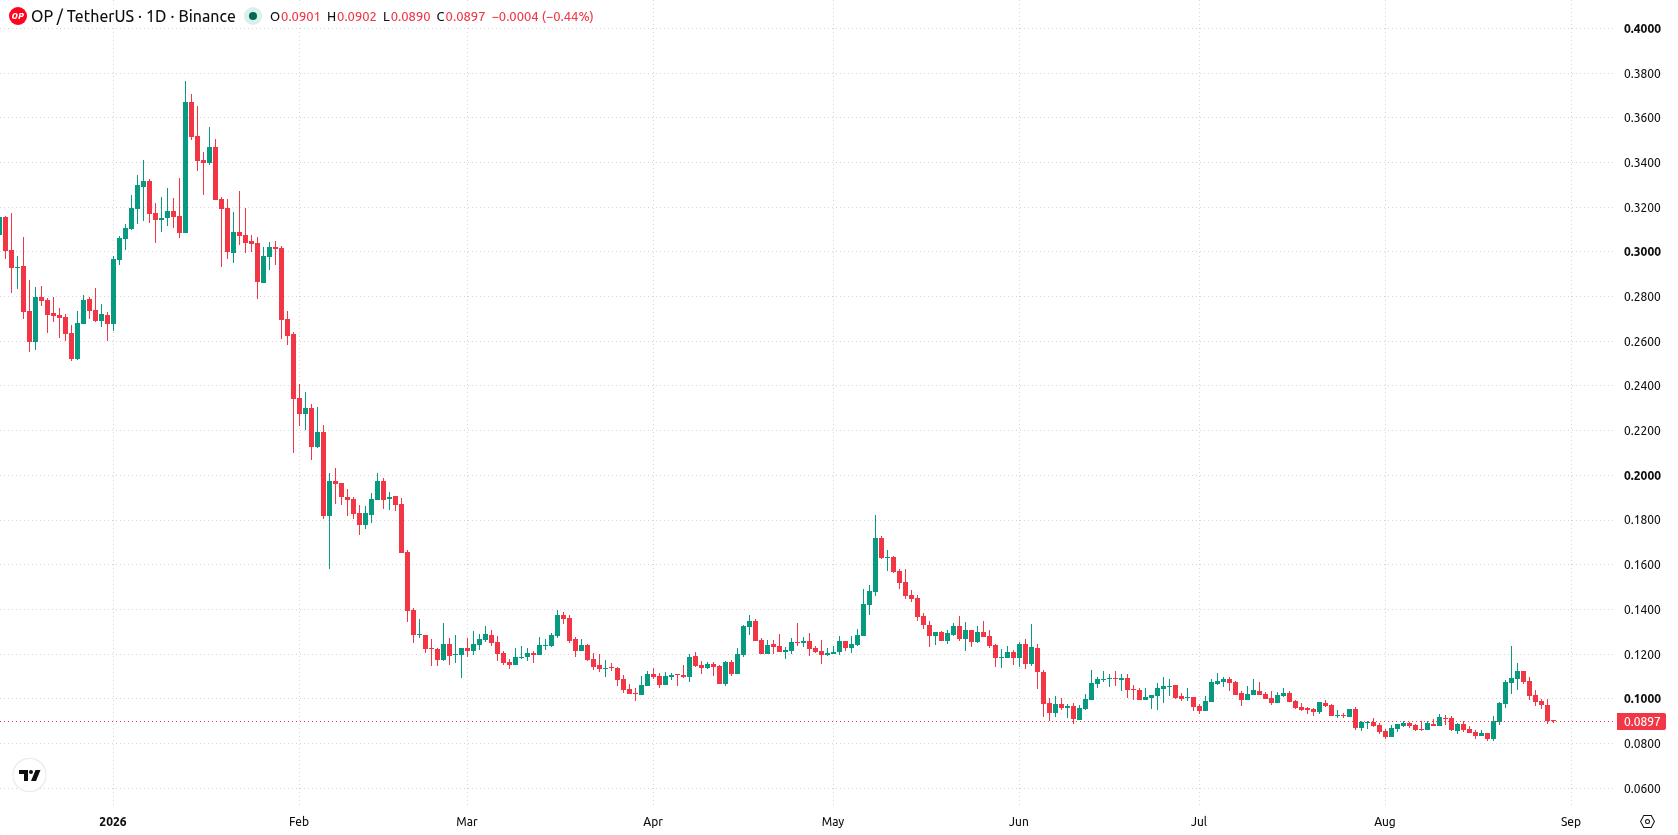
Optimism (OP) is trading near $0.09 after a steep slide of around 19% over the past week, as institutional developments become the key focus heading into September. With support levels tested by recent selling, fresh moves among major ecosystem stakeholders are increasingly likely to determine the pace and direction for the days ahead.
 0.0753
0.0930
Highlights
- Optimism trades at $0.0899 after a 19.14% decline over 7 days, staying well below key moving averages.
- Bearish pressure dominates with elevated volatility at 30.81% and unsettled momentum signals from MACD and ADX.
- Expected range for the next week is $0.0754 to $0.1043, with continued downside risk if support at $0.0886 fails.
Governance shift to ecosystem funds boosts institutional momentum this week
According to several sources, Optimism governance has approved the reallocation of 546.9 million OP tokens, previously reserved for user airdrops, into a Strategic Ecosystem Fund controlled by the Optimism Foundation. Outlets including Bitcoinist and CoinPaprika report that this initiative is designed to accelerate institutional partnerships and drive ecosystem incentives on both the OP Mainnet and OP Enterprise networks. The shift, finalized through a governance vote in late August 2026, underscores the protocol’s move away from broad airdrops and toward targeted institutional adoption in the coming week.
Conflicting momentum signals as price tests weekly support
On the daily chart, Optimism shows a sharp move lower without a sustained trend, with volatility elevated at 30.81%. Despite this weakness, the MACD and ADX both point higher—at odds with the price action—while the HMA remains in sell territory, underlining the unsettled momentum picture. Immediate support is seen at $0.0886, with resistance overhead at $0.0934 and further pressure expected from the Ichimoku Kijun at $0.1021. The asset's position near the bottom of its recent range suggests that sellers are still in control.
Bearish odds rise amid tight range and resistance constraints next week
Over the next 7 days, the expected range is $0.0754 to $0.1043, with a 22% probability of an increase and a 78% probability of a decrease. The base case is continued pressure beneath resistance at $0.0934, with only a sustained break above that level opening room for a recovery toward $0.1021. If Optimism trades below support at $0.0886, further downside toward $0.0754 is likely.
Earlier, analysts noted that Optimism was under sustained downward pressure, with sellers maintaining control as technical signals pointed to continued weakness. The current outlook not only reinforces this bearish bias but also highlights that persistent volatility and ongoing institutional developments mean traders should closely monitor the $0.0886 support level for signs of renewed downside risk.










-
 Afghanistan
-
 Albania
-
 Algeria
-
 Angola
-
 Argentina
-
 Armenia
-
 Australia
-
 Austria
-
 Azerbaijan
-
 Bahamas
-
 Bahrain
-
 Bangladesh
-
 Belarus
-
 Belgium
-
 Bolivia
-
 Botswana
-
 Brazil
-
 Brunei
-
 Bulgaria
-
 Cambodia
-
 Cameroon
-
 Canada
-
 Chile
-
 China
-
 Colombia
-
 Congo
-
 Costa Rica
-
 Cote d'Ivoire
-
 Croatia
-
 Cuba
-
 Cyprus
-
 Czechia
-
 DR Congo
-
 Denmark
-
 Dominican Republic
-
 Ecuador
-
 Egypt
-
 El Salvador
-
 Estonia
-
 Eswatini
-
 Ethiopia
-
 Finland
-
 France
-
 Georgia
-
 Germany
-
 Ghana
-
 Greece
-
 Haiti
-
 Hong Kong
-
 Hungary
-
 India
-
 Indonesia
-
 Iran, Islamic republic
-
 Iraq
-
 Ireland
-
 Israel
-
 Italy
-
 Jamaica
-
 Japan
-
 Jordan
-
 Kazakhstan
-
 Kenya
-
 Korea
-
 Kuwait
-
 Kyrgyzstan
-
 Laos
-
 Latvia
-
 Lebanon
-
 Lesotho
-
 Libya
-
 Lithuania
-
 Luxembourg
-
 Madagascar
-
 Malaysia
-
 Malta
-
 Mauritius
-
 Mexico
-
 Moldova
-
 Mongolia
-
 Montenegro
-
 Morocco
-
 Mozambique
-
 Myanmar
-
 Namibia
-
 Nepal
-
 Netherlands
-
 New Zealand
-
 Nigeria
-
 North Macedonia
-
 Norway
-
 Oman
-
 Pakistan
-
 Palestine
-
 Panama
-
 Papua New Guinea
-
 Paraguay
-
 Peru
-
 Philippines
-
 Poland
-
 Portugal
-
 Puerto Rico
-
 Qatar
-
 Reunion
-
 Romania
-
 Rwanda
-
 Saudi Arabia
-
 Serbia
-
 Singapore
-
 Slovakia
-
 Slovenia
-
 Somalia
-
 South Africa
-
 Spain
-
 Sri Lanka
-
 Sweden
-
 Switzerland
-
 Syria
-
 Taiwan
-
 Tajikistan
-
 Tanzania
-
 Thailand
-
 Trinidad and Tobago
-
 Tunisia
-
 Turkey
-
 UAE
-
 Uganda
-
 Ukraine
-
 United Kingdom
-
United States
-
 Uruguay
-
 Uzbekistan
-
 Venezuela
-
 Vietnam
-
 Yemen
-
 Zambia
-
 Zimbabwe
- Forex
- Crypto












