


SPX6900 (SPX) fell 10.07% today as intraday selling pressure overcame the prevailing bullish trend, with momentum indicators revealing signs of exhaustion. The move looks limited, with the index still trading above all major moving averages and holding constructive technical positioning.
 0.3623
0.4118
Highlights
- SPX6900 is trading above key moving averages, confirming a bullish trend across all major timeframes.
- Momentum indicators remain strong with buying interest persisting, though some are nearing overbought levels.
- Expected five-day range is $0.4288 to $0.7077, with 77% probability of an upward move and key resistance at $0.6476.
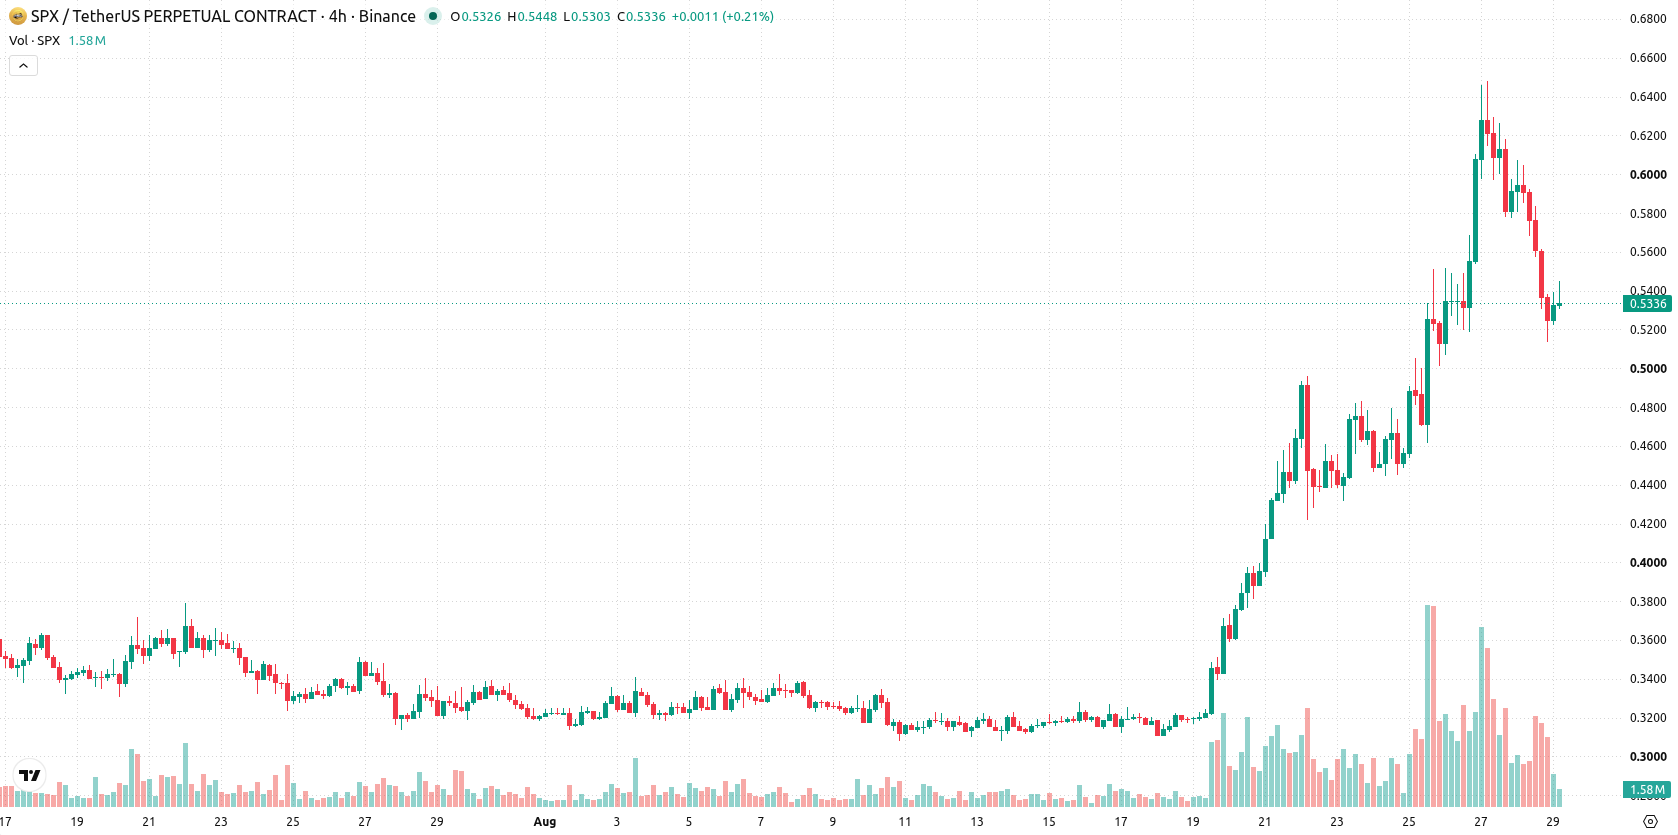
Bullish alignment endures despite overbought signals and mixed oscillators
SPX is trading above its 20-day ($0.4008), 50-day ($0.3661), and 200-day ($0.346) moving averages, which confirms a bullish structure across short-, medium-, and long-term trends. The nearest resistance is at $0.6476, and intraday support sits at $0.5342. The alignment of the 50-day and 200-day averages continues to back the bullish trend. Indicators show ongoing momentum, with MACD and ADX remaining supportive of buyers. The RSI at 66.70 and CCI at 119.54 signal that SPX is approaching overbought levels, and while the Stochastic RSI is neutral, the BBP and Awesome Oscillator reflect ongoing bullish momentum. Today's session saw a 10.07% drop with a downside gap of about 12.1%, but price action is holding near session highs and volatility is at 2.40%, pointing to resilience at higher levels. Some divergence among oscillators is present, though broader momentum maintains a positive tone.
Earlier, analysts noted that SPX6900 was experiencing significant volatility and a sharp pullback despite maintaining a constructive technical structure. The latest data add a new dimension, with price resilience and tightening volatility suggesting traders should closely monitor the projected volatility band between $0.4288 and $0.7077 for near-term direction.









-
 Afghanistan
-
 Albania
-
 Algeria
-
 Angola
-
 Argentina
-
 Armenia
-
 Australia
-
 Austria
-
 Azerbaijan
-
 Bahamas
-
 Bahrain
-
 Bangladesh
-
 Belarus
-
 Belgium
-
 Bolivia
-
 Botswana
-
 Brazil
-
 Brunei
-
 Bulgaria
-
 Cambodia
-
 Cameroon
-
 Canada
-
 Chile
-
 China
-
 Colombia
-
 Congo
-
 Costa Rica
-
 Cote d'Ivoire
-
 Croatia
-
 Cuba
-
 Cyprus
-
 Czechia
-
 DR Congo
-
 Denmark
-
 Dominican Republic
-
 Ecuador
-
 Egypt
-
 El Salvador
-
 Estonia
-
 Eswatini
-
 Ethiopia
-
 Finland
-
 France
-
 Georgia
-
 Germany
-
 Ghana
-
 Greece
-
 Haiti
-
 Hong Kong
-
 Hungary
-
 India
-
 Indonesia
-
 Iran, Islamic republic
-
 Iraq
-
 Ireland
-
 Israel
-
 Italy
-
 Jamaica
-
 Japan
-
 Jordan
-
 Kazakhstan
-
 Kenya
-
 Korea
-
 Kuwait
-
 Kyrgyzstan
-
 Laos
-
 Latvia
-
 Lebanon
-
 Lesotho
-
 Libya
-
 Lithuania
-
 Luxembourg
-
 Madagascar
-
 Malaysia
-
 Malta
-
 Mauritius
-
 Mexico
-
 Moldova
-
 Mongolia
-
 Montenegro
-
 Morocco
-
 Mozambique
-
 Myanmar
-
 Namibia
-
 Nepal
-
 Netherlands
-
 New Zealand
-
 Nigeria
-
 North Macedonia
-
 Norway
-
 Oman
-
 Pakistan
-
 Palestine
-
 Panama
-
 Papua New Guinea
-
 Paraguay
-
 Peru
-
 Philippines
-
 Poland
-
 Portugal
-
 Puerto Rico
-
 Qatar
-
 Reunion
-
 Romania
-
 Rwanda
-
 Saudi Arabia
-
 Serbia
-
 Singapore
-
 Slovakia
-
 Slovenia
-
 Somalia
-
 South Africa
-
 Spain
-
 Sri Lanka
-
 Sweden
-
 Switzerland
-
 Syria
-
 Taiwan
-
 Tajikistan
-
 Tanzania
-
 Thailand
-
 Trinidad and Tobago
-
 Tunisia
-
 Turkey
-
 UAE
-
 Uganda
-
 Ukraine
-
 United Kingdom
-
United States
-
 Uruguay
-
 Uzbekistan
-
 Venezuela
-
 Vietnam
-
 Yemen
-
 Zambia
-
 Zimbabwe
- Forex
- Crypto












