


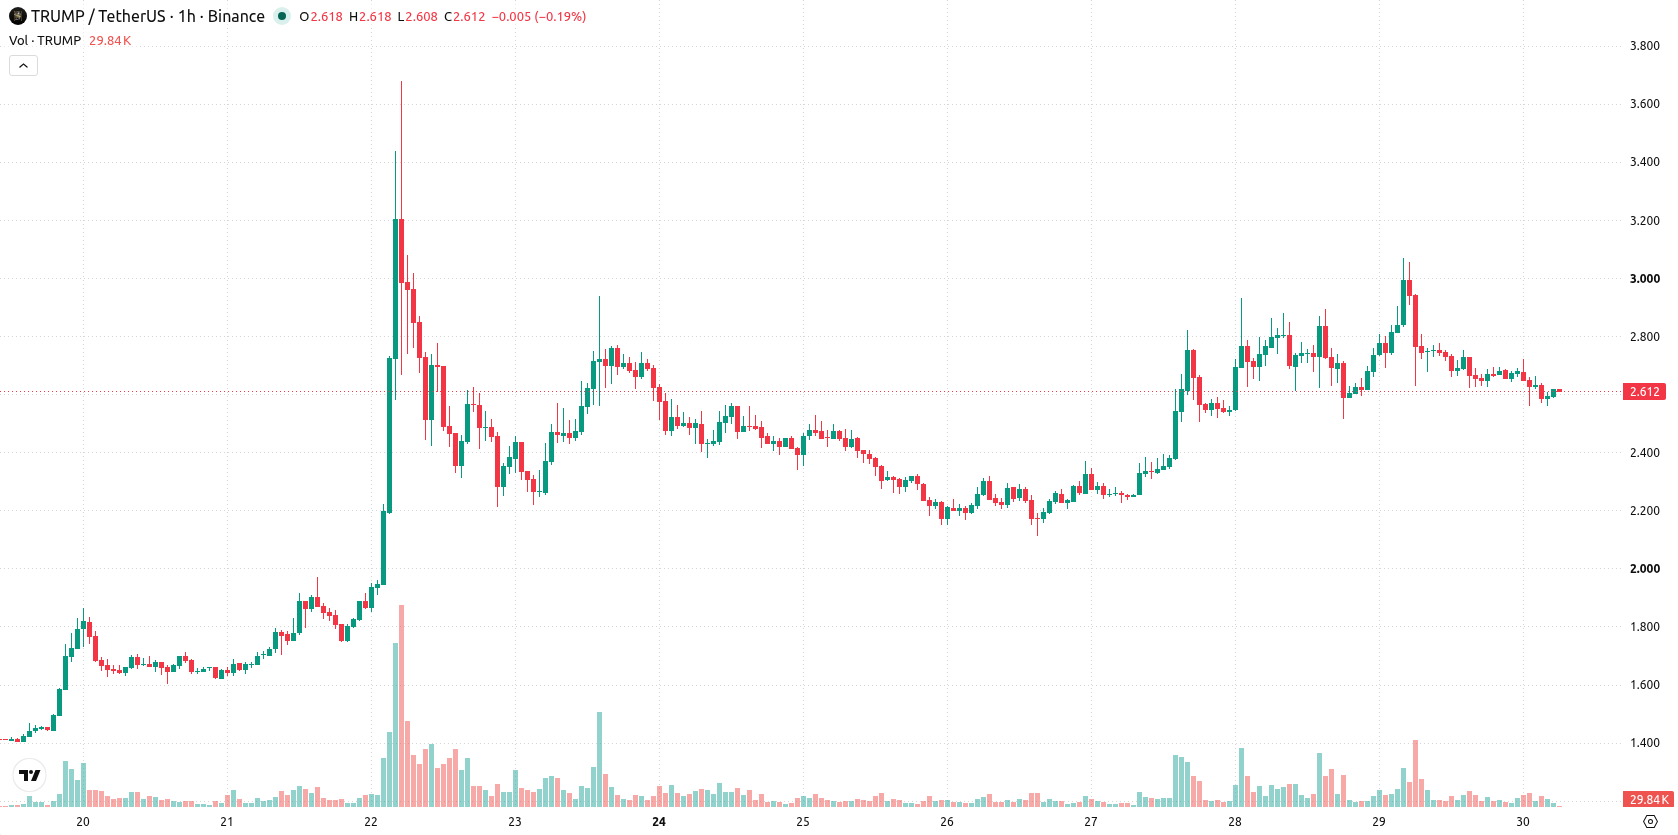
Official Trump (TRUMP) is trading at $2.62, marking a sharp daily decline of 9.97%. The asset currently sits below its key short- and medium-term moving averages but remains above its longer-term average.
 1.96
2.06
1.96
2.06
Highlights
- TRUMP trades below key short- and medium-term moving averages, confirming ongoing selling pressure in both timeframes.
- Multiple technical indicators, including MACD, RSI, and oscillators, show weak momentum and oversold conditions following today’s 9.97% intraday drop.
- Price is projected to consolidate in a $2.31 to $2.83 range over the next 2 to 3 days, with a 67% probability of further downside.
Negative technical momentum as sellers exhaust near key supports
TRUMP has broken below its MA-20 and MA-50 levels on the H1 chart, suggesting both short- and medium-term momentum are tilted negative. The price, however, remains above the daily MA-200, which serves as a line of longer-term support. The Ichimoku Kijun is set at $2.81, identifying this level as immediate resistance. MACD is on a Sell signal, ADX reads Neutral, and RSI is at 36.34, indicating negative momentum. Stoch RSI and CCI both reflect oversold conditions, implying possible exhaustion of sellers in the short term. Bull/Bear Power points to ongoing selling dominance intraday, while the Awesome Oscillator confirms the downside momentum remains in play.
Probable downside consolidation as volatility band contains direction
Over the next 2–3 trading days, TRUMP is expected to consolidate between $2.31 and $2.83. Forecast models indicate a 67% probability of continued downside, versus a 33% chance of an upward reversal. Lateral movement within this volatility band is the baseline scenario. A decisive break above $2.81 would open the way to a bullish reversal, whereas a slide below $2.31 could extend the current bearish trend.
Previously it was reported that investors in TRUMP and related cryptocurrency ventures suffered significant losses, with the majority of profits concentrated among early adopters. The current technical environment underscores ongoing bearish momentum, making a break below $2.31 a crucial downside risk to monitor for further weakness.











-
 Afghanistan
-
 Albania
-
 Algeria
-
 Angola
-
 Argentina
-
 Armenia
-
 Australia
-
 Austria
-
 Azerbaijan
-
 Bahamas
-
 Bahrain
-
 Bangladesh
-
 Belarus
-
 Belgium
-
 Bolivia
-
 Botswana
-
 Brazil
-
 Brunei
-
 Bulgaria
-
 Cambodia
-
 Cameroon
-
 Canada
-
 Chile
Chile
-
 China
China
-
 Colombia
-
 Congo
Congo
-
 Costa Rica
-
 Cote d'Ivoire
-
 Croatia
-
 Cuba
Cuba
-
 Cyprus
-
 Czechia
-
 DR Congo
-
 Denmark
-
 Dominican Republic
-
 Ecuador
-
 Egypt
Egypt
-
 El Salvador
-
 Estonia
-
 Eswatini
-
 Ethiopia
-
 Finland
-
 France
-
 Georgia
-
 Germany
-
 Ghana
Ghana
-
 Greece
-
 Haiti
Haiti
-
 Hong Kong
-
 Hungary
-
 India
India
-
 Indonesia
-
 Iran, Islamic republic
-
 Iraq
Iraq
-
 Ireland
-
 Israel
-
 Italy
Italy
-
 Jamaica
-
 Japan
Japan
-
 Jordan
-
 Kazakhstan
-
 Kenya
Kenya
-
 Korea
Korea
-
 Kuwait
-
 Kyrgyzstan
-
 Laos
Laos
-
 Latvia
-
 Lebanon
-
 Lesotho
-
 Libya
Libya
-
 Lithuania
-
 Luxembourg
-
 Madagascar
-
 Malaysia
-
 Malta
Malta
-
 Mauritius
-
 Mexico
-
 Moldova
-
 Mongolia
-
 Montenegro
-
 Morocco
-
 Mozambique
-
 Myanmar
-
 Namibia
-
 Nepal
Nepal
-
 Netherlands
-
 New Zealand
-
 Nigeria
-
 North Macedonia
-
 Norway
-
 Oman
Oman
-
 Pakistan
-
 Palestine
-
 Panama
-
 Papua New Guinea
-
 Paraguay
-
 Peru
Peru
-
 Philippines
-
 Poland
-
 Portugal
-
 Puerto Rico
-
 Qatar
Qatar
-
 Reunion
-
 Romania
-
 Rwanda
-
 Saudi Arabia
-
 Serbia
-
 Singapore
-
 Slovakia
-
 Slovenia
-
 Somalia
-
 South Africa
-
 Spain
Spain
-
 Sri Lanka
-
 Sweden
-
 Switzerland
-
 Syria
Syria
-
 Taiwan
-
 Tajikistan
-
 Tanzania
-
 Thailand
-
 Trinidad and Tobago
-
 Tunisia
-
 Turkey
-
 UAE
UAE
-
 Uganda
-
 Ukraine
-
 United Kingdom
-
United States
-
 Uruguay
-
 Uzbekistan
-
 Venezuela
-
 Vietnam
-
 Yemen
Yemen
-
 Zambia
-
 Zimbabwe
- Forex
- Crypto












