

Polygon retracement deepens with Stochastic RSI flashing oversold signals: weekly analysis

Polygon (POL) has extended its drop to near $0.09 this week, tumbling by more than 24% as selling pressure pushes the token into deeply oversold territory. Technical signals now show a stark contrast between a firmly bearish trend and initial signs that downward momentum may be waning — the setup is primed for volatility as traders look for stabilization or a potential reversal in the days ahead.
 0.0928
0.0950
Highlights
- Polygon fell 24.29% over the past week, ending at $0.0908 and closing near the bottom of its weekly range.
- The price remains below the 20-day moving average but above the 50- and 200-day averages, indicating a bearish long-term trend with high near-term volatility.
- Expected range for the coming week is $0.0771 to $0.1044, with a slight probability edge for an increase, and key levels at $0.0889 and $0.0944.
Network upgrades and record activity bolster sentiment during the week
Polygon recently rolled out two mandatory security upgrades, the Austin and Kyoto hard forks, on its proof-of-stake network to address validator and consensus vulnerabilities, according to crypto.news. Polygon Labs confirmed that no exploits occurred on the mainnet prior to these fixes and that all node operators must upgrade to maintain consensus. Multiple sources, including TronWeekly and en.coin-turk.com, noted that Polygon surpassed 8 billion cumulative transactions and set new records for stablecoin volume and transfers, while Benzinga and CryptoTimes highlighted Polymarket's $1 billion funding round on the Polygon network.
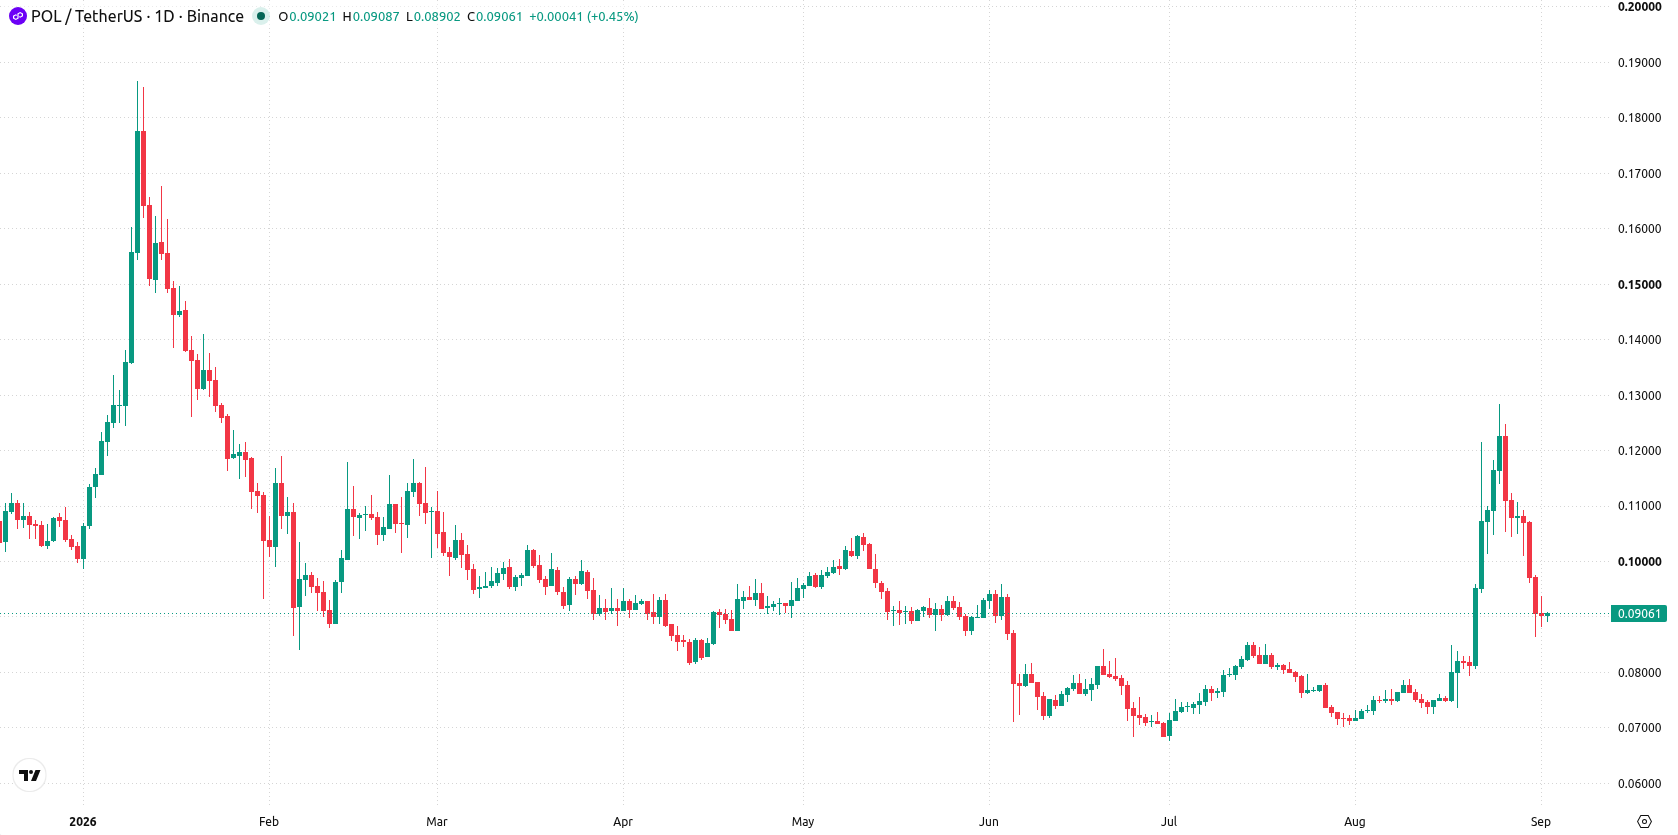
Bearish trend sustained as oversold technicals challenge downside momentum
On the daily chart, the structure is marked by a sustained move lower with a firm trend, reinforced by 29.86% volatility for the week. MACD points to ongoing bullish momentum, while Stochastic RSI is deeply oversold at 0, suggesting bears may be losing steam even as the trend remains down. The nearest support is at the MA-200 ($0.0889), with resistance at the MA-20 ($0.0944) and a further barrier from the Ichimoku Kijun at $0.1004.
Narrower trading range targeted as trend stabilization eyed next week
Over the coming week, the expected range is $0.0771 to $0.1044, with a 53% probability of an increase and a 47% chance of a decrease. The base case sees Polygon trading between $0.0889 and $0.0944 as the trend stabilizes. A break above resistance at $0.0944 could open room for a rebound towards $0.1044. If support at $0.0889 fails, further downside towards $0.0771 is likely.
Previously it was reported that Polygon faced heightened selling pressure and technical challenges following major network upgrades, though medium-term momentum indicators pointed to potential stabilization. The latest analysis highlights an elevated volatility environment and a deeply oversold structure, making the $0.0889 level a pivotal support to watch for any signs of reversal or further downside.






Latest Polygon News





-
 Afghanistan
-
 Albania
-
 Algeria
-
 Angola
-
 Argentina
-
 Armenia
-
 Australia
-
 Austria
-
 Azerbaijan
-
 Bahamas
-
 Bahrain
-
 Bangladesh
-
 Belarus
-
 Belgium
-
 Bolivia
-
 Botswana
-
 Brazil
-
 Brunei
-
 Bulgaria
-
 Cambodia
-
 Cameroon
-
 Canada
-
 Chile
-
 China
-
 Colombia
-
 Congo
-
 Costa Rica
-
 Cote d'Ivoire
-
 Croatia
-
 Cuba
-
 Cyprus
-
 Czechia
-
 DR Congo
-
 Denmark
-
 Dominican Republic
-
 Ecuador
-
 Egypt
-
 El Salvador
-
 Estonia
-
 Eswatini
-
 Ethiopia
-
 Finland
-
 France
-
 Georgia
-
 Germany
-
 Ghana
-
 Greece
-
 Haiti
-
 Hong Kong
-
 Hungary
-
 India
-
 Indonesia
-
 Iran, Islamic republic
-
 Iraq
-
 Ireland
-
 Israel
-
 Italy
-
 Jamaica
-
 Japan
-
 Jordan
-
 Kazakhstan
-
 Kenya
-
 Korea
-
 Kuwait
-
 Kyrgyzstan
-
 Laos
-
 Latvia
-
 Lebanon
-
 Lesotho
-
 Libya
-
 Lithuania
-
 Luxembourg
-
 Madagascar
-
 Malaysia
-
 Malta
-
 Mauritius
-
 Mexico
-
 Moldova
-
 Mongolia
-
 Montenegro
-
 Morocco
-
 Mozambique
-
 Myanmar
-
 Namibia
-
 Nepal
-
 Netherlands
-
 New Zealand
-
 Nigeria
-
 North Macedonia
-
 Norway
-
 Oman
-
 Pakistan
-
 Palestine
-
 Panama
-
 Papua New Guinea
-
 Paraguay
-
 Peru
-
 Philippines
-
 Poland
-
 Portugal
-
 Puerto Rico
-
 Qatar
-
 Reunion
-
 Romania
-
 Rwanda
-
 Saudi Arabia
-
 Serbia
-
 Singapore
-
 Slovakia
-
 Slovenia
-
 Somalia
-
 South Africa
-
 Spain
-
 Sri Lanka
-
 Sweden
-
 Switzerland
-
 Syria
-
 Taiwan
-
 Tajikistan
-
 Tanzania
-
 Thailand
-
 Trinidad and Tobago
-
 Tunisia
-
 Turkey
-
 UAE
-
 Uganda
-
 Ukraine
-
 United Kingdom
-
United States
-
 Uruguay
-
 Uzbekistan
-
 Venezuela
-
 Vietnam
-
 Yemen
-
 Zambia
-
 Zimbabwe
- Forex
- Crypto












