

The Graph tests $0.020501 resistance as buyer support drives surge

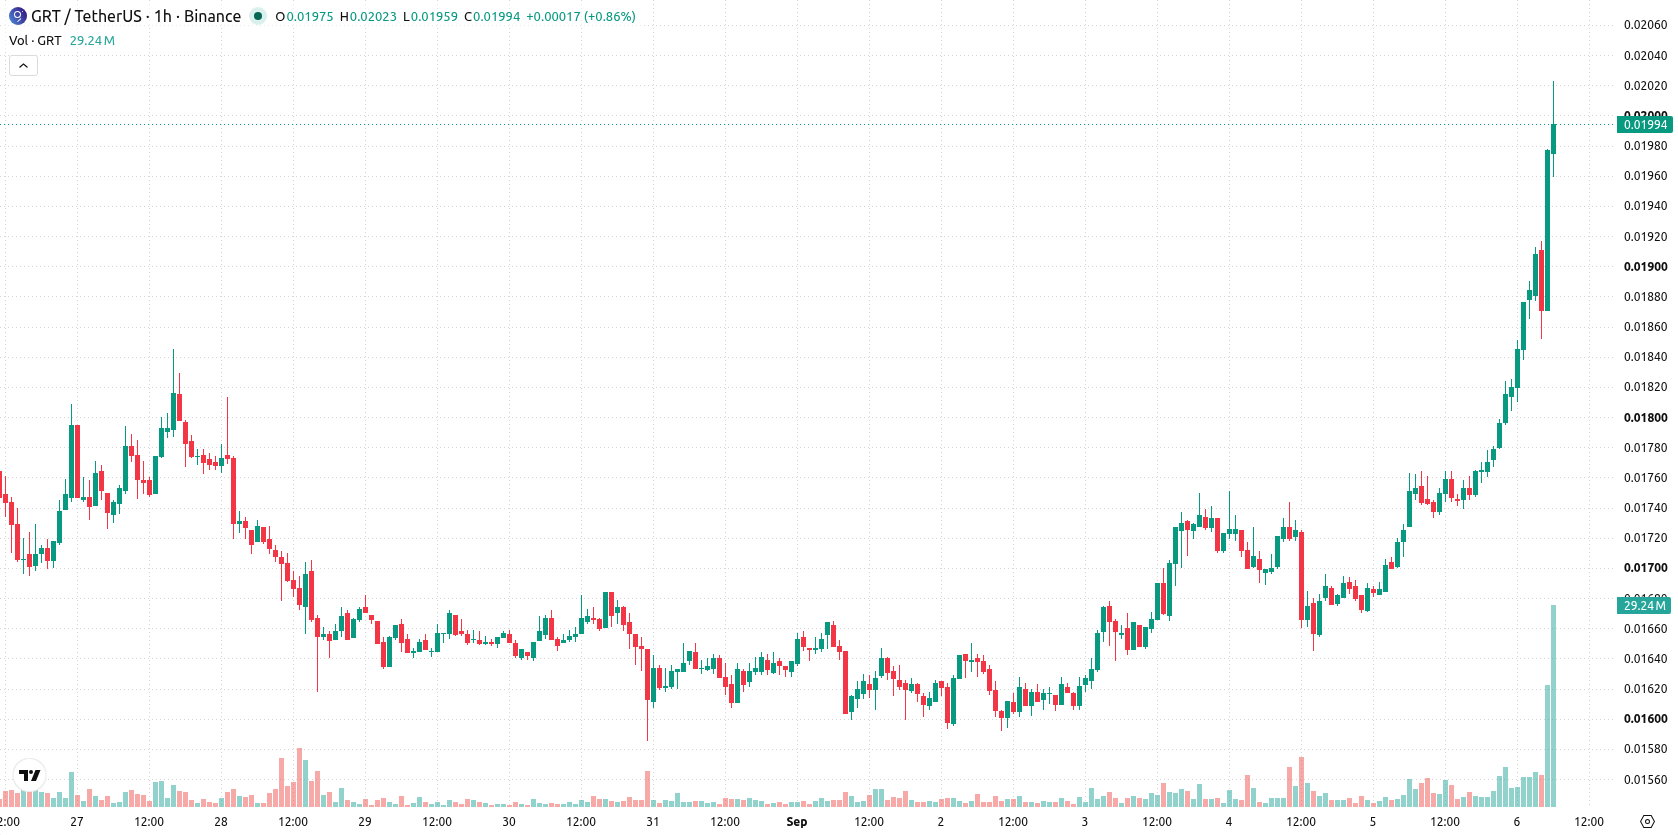
The Graph (GRT) is trading at $0.01998, up 13.91% on the day and positioned above its key short- and medium-term moving averages. The price is showing notable momentum, sitting near the day's high.
 0.02713
0.02922000
0.02713
0.02922000
Highlights
- GRT/USD trades with strong near-term and mid-term bullish momentum but faces longer-term resistance below its daily MA-200.
- Bullish indicators dominate as price jumps 13.91% to $0.01998, with oscillators warning of overbought conditions and momentum moderating.
- Price is expected to consolidate in the $0.01866 to $0.020501 range, with a high probability of further upside and limited downside risk.
Bullish momentum holds as overbought signals flash caution
On the technical front, GRT is trading above its MA-20 and MA-50 on the hourly chart, while remaining below the daily MA-200. The Ichimoku Kijun provides immediate support at $0.018085. Momentum indicators reinforce the bullish setting, with both MACD and ADX showing strength. RSI is elevated at 74.15 and, together with CCI, points to overbought conditions. Stoch RSI appears neutral, suggesting some moderation in short-term momentum. The Bull/Bear Power indicator and Awesome Oscillator both confirm persistent buyer dominance intraday. A gap of $0.00066 has formed following the recent price surge.
Potential breakout eyed as range narrows and upside risks build
Looking forward, GRT is likely to consolidate within a volatility band ranging from $0.01866 to $0.020501 over the next several days. The probability of additional upside is very high, while the risk of a downside reversal remains low. If the price breaks firmly above the upper resistance, a renewed bullish phase could accelerate. Conversely, any sharp pullback below immediate support at the Kijun may introduce near-term weakness.
Earlier, analysts noted that The Graph had shifted into a new uptrend following a breakout above its prior consolidation range. The latest technical signals reinforce this bullish transition, making the upper boundary of the current volatility band an essential level to watch for signs of further momentum.











-
 Afghanistan
-
 Albania
-
 Algeria
-
 Angola
-
 Argentina
-
 Armenia
-
 Australia
-
 Austria
-
 Azerbaijan
-
 Bahamas
-
 Bahrain
-
 Bangladesh
-
 Belarus
-
 Belgium
-
 Bolivia
-
 Botswana
-
 Brazil
-
 Brunei
-
 Bulgaria
-
 Cambodia
-
 Cameroon
-
 Canada
-
 Chile
Chile
-
 China
China
-
 Colombia
-
 Congo
Congo
-
 Costa Rica
-
 Cote d'Ivoire
-
 Croatia
-
 Cuba
Cuba
-
 Cyprus
-
 Czechia
-
 DR Congo
-
 Denmark
-
 Dominican Republic
-
 Ecuador
-
 Egypt
Egypt
-
 El Salvador
-
 Estonia
-
 Eswatini
-
 Ethiopia
-
 Finland
-
 France
-
 Georgia
-
 Germany
-
 Ghana
Ghana
-
 Greece
-
 Haiti
Haiti
-
 Hong Kong
-
 Hungary
-
 India
India
-
 Indonesia
-
 Iran, Islamic republic
-
 Iraq
Iraq
-
 Ireland
-
 Israel
-
 Italy
Italy
-
 Jamaica
-
 Japan
Japan
-
 Jordan
-
 Kazakhstan
-
 Kenya
Kenya
-
 Korea
Korea
-
 Kuwait
-
 Kyrgyzstan
-
 Laos
Laos
-
 Latvia
-
 Lebanon
-
 Lesotho
-
 Libya
Libya
-
 Lithuania
-
 Luxembourg
-
 Madagascar
-
 Malaysia
-
 Malta
Malta
-
 Mauritius
-
 Mexico
-
 Moldova
-
 Mongolia
-
 Montenegro
-
 Morocco
-
 Mozambique
-
 Myanmar
-
 Namibia
-
 Nepal
Nepal
-
 Netherlands
-
 New Zealand
-
 Nigeria
-
 North Macedonia
-
 Norway
-
 Oman
Oman
-
 Pakistan
-
 Palestine
-
 Panama
-
 Papua New Guinea
-
 Paraguay
-
 Peru
Peru
-
 Philippines
-
 Poland
-
 Portugal
-
 Puerto Rico
-
 Qatar
Qatar
-
 Reunion
-
 Romania
-
 Rwanda
-
 Saudi Arabia
-
 Serbia
-
 Singapore
-
 Slovakia
-
 Slovenia
-
 Somalia
-
 South Africa
-
 Spain
Spain
-
 Sri Lanka
-
 Sweden
-
 Switzerland
-
 Syria
Syria
-
 Taiwan
-
 Tajikistan
-
 Tanzania
-
 Thailand
-
 Trinidad and Tobago
-
 Tunisia
-
 Turkey
-
 UAE
UAE
-
 Uganda
-
 Ukraine
-
 United Kingdom
-
United States
-
 Uruguay
-
 Uzbekistan
-
 Venezuela
-
 Vietnam
-
 Yemen
Yemen
-
 Zambia
-
 Zimbabwe
- Forex
- Crypto












