

The Graph rises over 18% as technical momentum accelerates despite long-term resistance

Strong technical momentum triggered an 18.09% surge in The Graph (GRT). The advance is marked by persistent upside but remains limited, as GRT trades below its 200-day moving average and faces potential longer-term resistance.
 0.02821
0.02980000
0.02821
0.02980000
Highlights
- GRT/USD trades above its short- and medium-term moving averages but remains below the long-term 200-day average, indicating renewed momentum with persistent longer-term resistance.
- Momentum indicators such as MACD, ADX, and AO all deliver positive signals, and buyers control intraday flows, with volatility at 14.86%.
- Projected range for the next five sessions is $0.019525 to $0.021855, with an upside probability above 80% and consolidation anticipated near current levels.
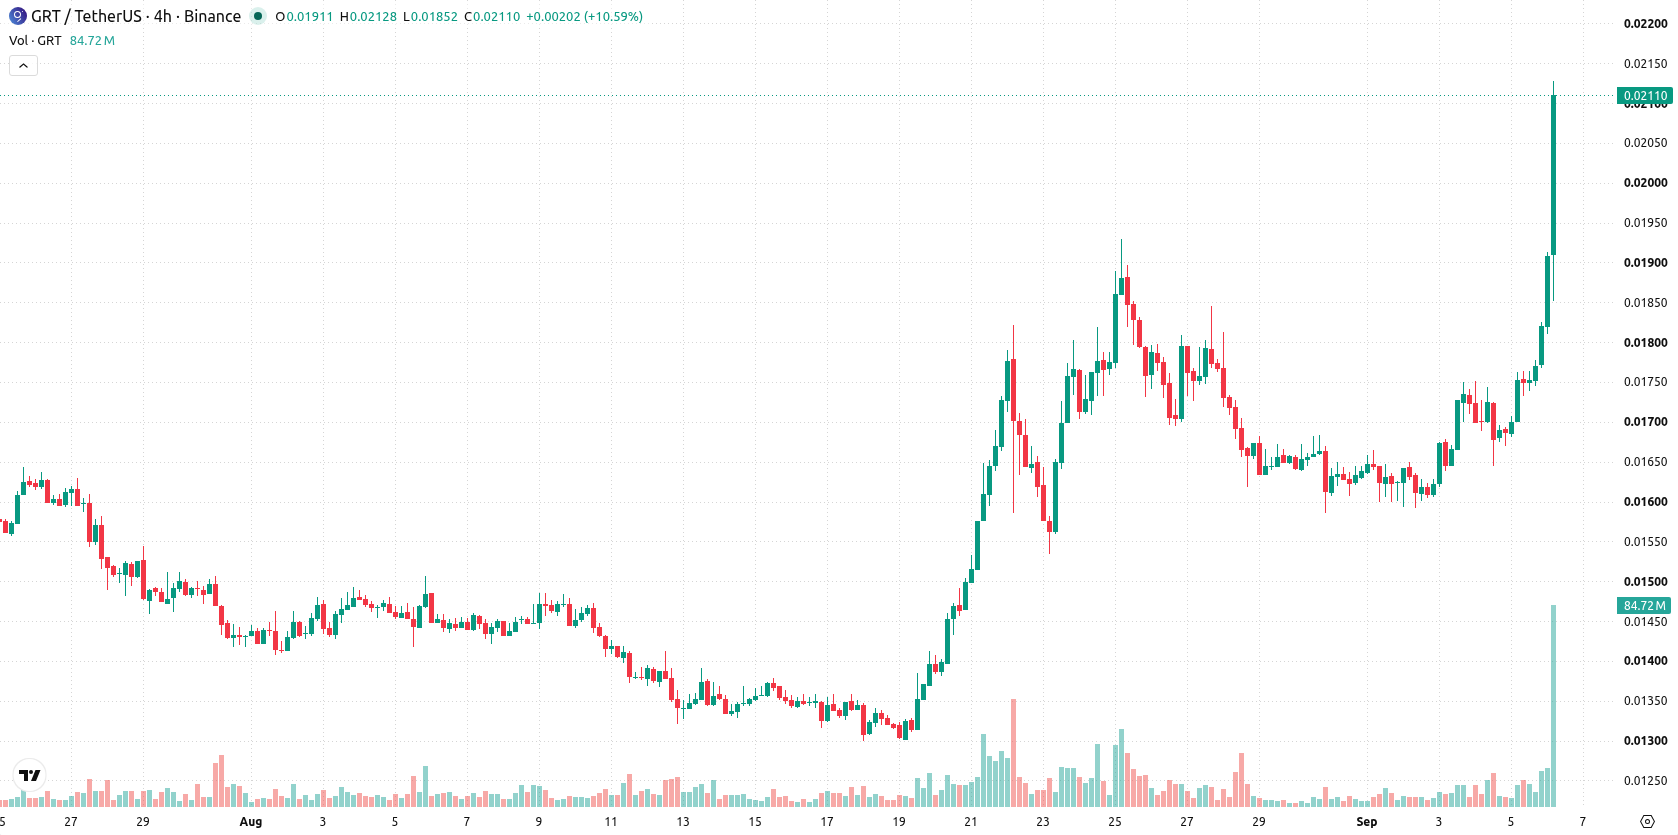
Mixed trend signals as short-term gains face long-term resistance
GRT/USD trades above its 20-day and 50-day moving averages ($0.016387 and $0.0155216), but remains below the 200-day average ($0.02155555). This setup suggests the pair has regained positive short- and medium-term momentum, yet still faces a bearish alignment in the longer term with potential overhead pressure. Momentum gauges are positive, with the MACD and ADX both indicating buy signals and strengthening trend participation. RSI, Stochastic RSI, and CCI each stay well below overbought readings, pointing to further upside room. Bull/Bear Power (BBP) is above zero, confirming buyers dominate intraday flows. The Awesome Oscillator (AO) supports the advancing tone. GRT/USD surged $0.00317 or 18.09% higher on strong upside momentum, with an upside gap of 3.88% and price finishing near the session high. Intraday volatility stands at 14.86%. The overall tone is resilient with persistent strength into highs.
Earlier, analysts noted that The Graph was in a bullish phase, supported by positive technical momentum and persistent buyer activity. The latest data not only reinforce that outlook but also highlight the importance of monitoring the $0.02079 resistance, as a decisive break above this level could signal an acceleration in the current uptrend.











-
 Afghanistan
-
 Albania
-
 Algeria
-
 Angola
-
 Argentina
-
 Armenia
-
 Australia
-
 Austria
-
 Azerbaijan
-
 Bahamas
-
 Bahrain
-
 Bangladesh
-
 Belarus
-
 Belgium
-
 Bolivia
-
 Botswana
-
 Brazil
-
 Brunei
-
 Bulgaria
-
 Cambodia
-
 Cameroon
-
 Canada
-
 Chile
Chile
-
 China
China
-
 Colombia
-
 Congo
Congo
-
 Costa Rica
-
 Cote d'Ivoire
-
 Croatia
-
 Cuba
Cuba
-
 Cyprus
-
 Czechia
-
 DR Congo
-
 Denmark
-
 Dominican Republic
-
 Ecuador
-
 Egypt
Egypt
-
 El Salvador
-
 Estonia
-
 Eswatini
-
 Ethiopia
-
 Finland
-
 France
-
 Georgia
-
 Germany
-
 Ghana
Ghana
-
 Greece
-
 Haiti
Haiti
-
 Hong Kong
-
 Hungary
-
 India
India
-
 Indonesia
-
 Iran, Islamic republic
-
 Iraq
Iraq
-
 Ireland
-
 Israel
-
 Italy
Italy
-
 Jamaica
-
 Japan
Japan
-
 Jordan
-
 Kazakhstan
-
 Kenya
Kenya
-
 Korea
Korea
-
 Kuwait
-
 Kyrgyzstan
-
 Laos
Laos
-
 Latvia
-
 Lebanon
-
 Lesotho
-
 Libya
Libya
-
 Lithuania
-
 Luxembourg
-
 Madagascar
-
 Malaysia
-
 Malta
Malta
-
 Mauritius
-
 Mexico
-
 Moldova
-
 Mongolia
-
 Montenegro
-
 Morocco
-
 Mozambique
-
 Myanmar
-
 Namibia
-
 Nepal
Nepal
-
 Netherlands
-
 New Zealand
-
 Nigeria
-
 North Macedonia
-
 Norway
-
 Oman
Oman
-
 Pakistan
-
 Palestine
-
 Panama
-
 Papua New Guinea
-
 Paraguay
-
 Peru
Peru
-
 Philippines
-
 Poland
-
 Portugal
-
 Puerto Rico
-
 Qatar
Qatar
-
 Reunion
-
 Romania
-
 Rwanda
-
 Saudi Arabia
-
 Serbia
-
 Singapore
-
 Slovakia
-
 Slovenia
-
 Somalia
-
 South Africa
-
 Spain
Spain
-
 Sri Lanka
-
 Sweden
-
 Switzerland
-
 Syria
Syria
-
 Taiwan
-
 Tajikistan
-
 Tanzania
-
 Thailand
-
 Trinidad and Tobago
-
 Tunisia
-
 Turkey
-
 UAE
UAE
-
 Uganda
-
 Ukraine
-
 United Kingdom
-
United States
-
 Uruguay
-
 Uzbekistan
-
 Venezuela
-
 Vietnam
-
 Yemen
Yemen
-
 Zambia
-
 Zimbabwe
- Forex
- Crypto












