


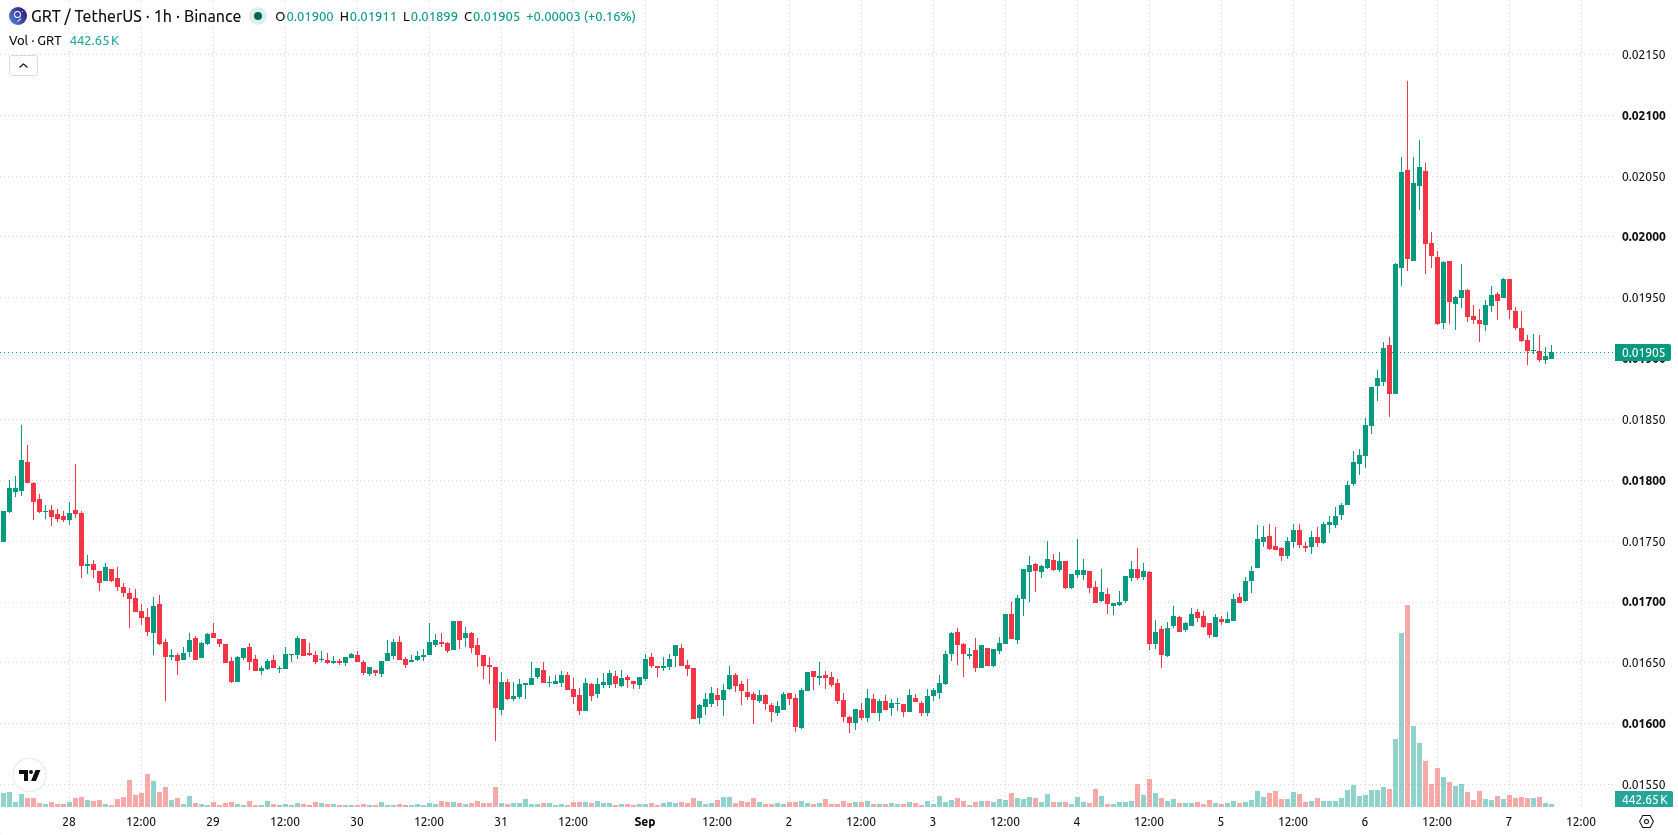
The Graph (GRT) is trading at $0.01901, down 7.31% on the day. The price is positioned below its key short-term average but remains above the intermediate one, while staying under longer-term benchmarks.
 0.01711
0.01847000
Highlights
- GRT/USD remains under long-term moving averages with both short-term and long-term downside pressure indicated.
- Technical indicators present mixed momentum signals, with MACD as strong buy but other oscillators showing sellers dominate and oversold conditions.
- Price is forecast to consolidate in a $0.01781147 to $0.02020853 range over the next two to three days, with $0.0199 as key resistance.
Mixed momentum and resistance as downside persists
GRT/USD trades below the MA-20 and above the MA-50, while remaining under the long-term MA-200. The Ichimoku Kijun at $0.0199 acts as immediate resistance. Momentum indicators present a mixed setup: MACD signals a strong buy, ADX shows a buy, but Bull/Bear Power points to sellers dominating. The RSI is at 49 (sell), and both the Stochastic RSI and CCI indicate oversold conditions. The Awesome Oscillator aligns with the prevailing downtrend, and intraday action confirms persistent bearish sentiment with price near today's low and moderate volatility. Divergence between the bullish MACD and oversold oscillators highlights short-term uncertainty, while intraday momentum continues to favor sellers.
Sideways bias as breakout triggers remain in focus
Over the next two to three trading days, GRT is expected to consolidate within the $0.01781147 to $0.02020853 band. The probability of a move higher stands at 59%, while a downward move is less likely at 41%. The baseline scenario projects sideways price action constrained within this range; a push above $0.0199 opens potential for further gains, while a sustained drop below support could see losses extend toward the lower boundary.
Earlier, analysts noted that The Graph had established positive momentum, supported by resilient buying activity despite lingering longer-term resistance. The current mixed technical signals and prevailing downside pressure suggest traders should watch for a decisive move above $0.0199 or below $0.01781 as a potential catalyst for the next trend direction.














-
 Afghanistan
-
 Albania
-
 Algeria
-
 Angola
-
 Argentina
-
 Armenia
-
 Australia
-
 Austria
-
 Azerbaijan
-
 Bahamas
-
 Bahrain
-
 Bangladesh
-
 Belarus
-
 Belgium
-
 Bolivia
-
 Botswana
-
 Brazil
-
 Brunei
-
 Bulgaria
-
 Cambodia
-
 Cameroon
-
 Canada
-
 Chile
-
 China
-
 Colombia
-
 Congo
-
 Costa Rica
-
 Cote d'Ivoire
-
 Croatia
-
 Cuba
-
 Cyprus
-
 Czechia
-
 DR Congo
-
 Denmark
-
 Dominican Republic
-
 Ecuador
-
 Egypt
-
 El Salvador
-
 Estonia
-
 Eswatini
-
 Ethiopia
-
 Finland
-
 France
-
 Georgia
-
 Germany
-
 Ghana
-
 Greece
-
 Haiti
-
 Hong Kong
-
 Hungary
-
 India
-
 Indonesia
-
 Iran, Islamic republic
-
 Iraq
-
 Ireland
-
 Israel
-
 Italy
-
 Jamaica
-
 Japan
-
 Jordan
-
 Kazakhstan
-
 Kenya
-
 Korea
-
 Kuwait
-
 Kyrgyzstan
-
 Laos
-
 Latvia
-
 Lebanon
-
 Lesotho
-
 Libya
-
 Lithuania
-
 Luxembourg
-
 Madagascar
-
 Malaysia
-
 Malta
-
 Mauritius
-
 Mexico
-
 Moldova
-
 Mongolia
-
 Montenegro
-
 Morocco
-
 Mozambique
-
 Myanmar
-
 Namibia
-
 Nepal
-
 Netherlands
-
 New Zealand
-
 Nigeria
-
 North Macedonia
-
 Norway
-
 Oman
-
 Pakistan
-
 Palestine
-
 Panama
-
 Papua New Guinea
-
 Paraguay
-
 Peru
-
 Philippines
-
 Poland
-
 Portugal
-
 Puerto Rico
-
 Qatar
-
 Reunion
-
 Romania
-
 Rwanda
-
 Saudi Arabia
-
 Serbia
-
 Singapore
-
 Slovakia
-
 Slovenia
-
 Somalia
-
 South Africa
-
 Spain
-
 Sri Lanka
-
 Sweden
-
 Switzerland
-
 Syria
-
 Taiwan
-
 Tajikistan
-
 Tanzania
-
 Thailand
-
 Trinidad and Tobago
-
 Tunisia
-
 Turkey
-
 UAE
-
 Uganda
-
 Ukraine
-
 United Kingdom
-
United States
-
 Uruguay
-
 Uzbekistan
-
 Venezuela
-
 Vietnam
-
 Yemen
-
 Zambia
-
 Zimbabwe
- Forex
- Crypto












