


Raydium (RAY) surged 19.13% on strong buying momentum, as technical signals triggered fresh demand in the absence of a news catalyst. The move is reinforced by the asset breaking above all major moving averages and exhibiting firm bullish structure, yet overbought indicators hint that gains may be increasingly stretched.
 2.0868
2.5300
2.0868
2.5300
Highlights
- RAY/USD is trading above its short, medium, and long-term moving averages, indicating bullish momentum across timeframes.
- Momentum indicators show strong buy signals, however some oscillators warn of overbought conditions and the potential for a pause or consolidation.
- The pair trades at $1.3175 with strong intraday gains and is expected to range between $1.054 and $1.8999 over the next five days.
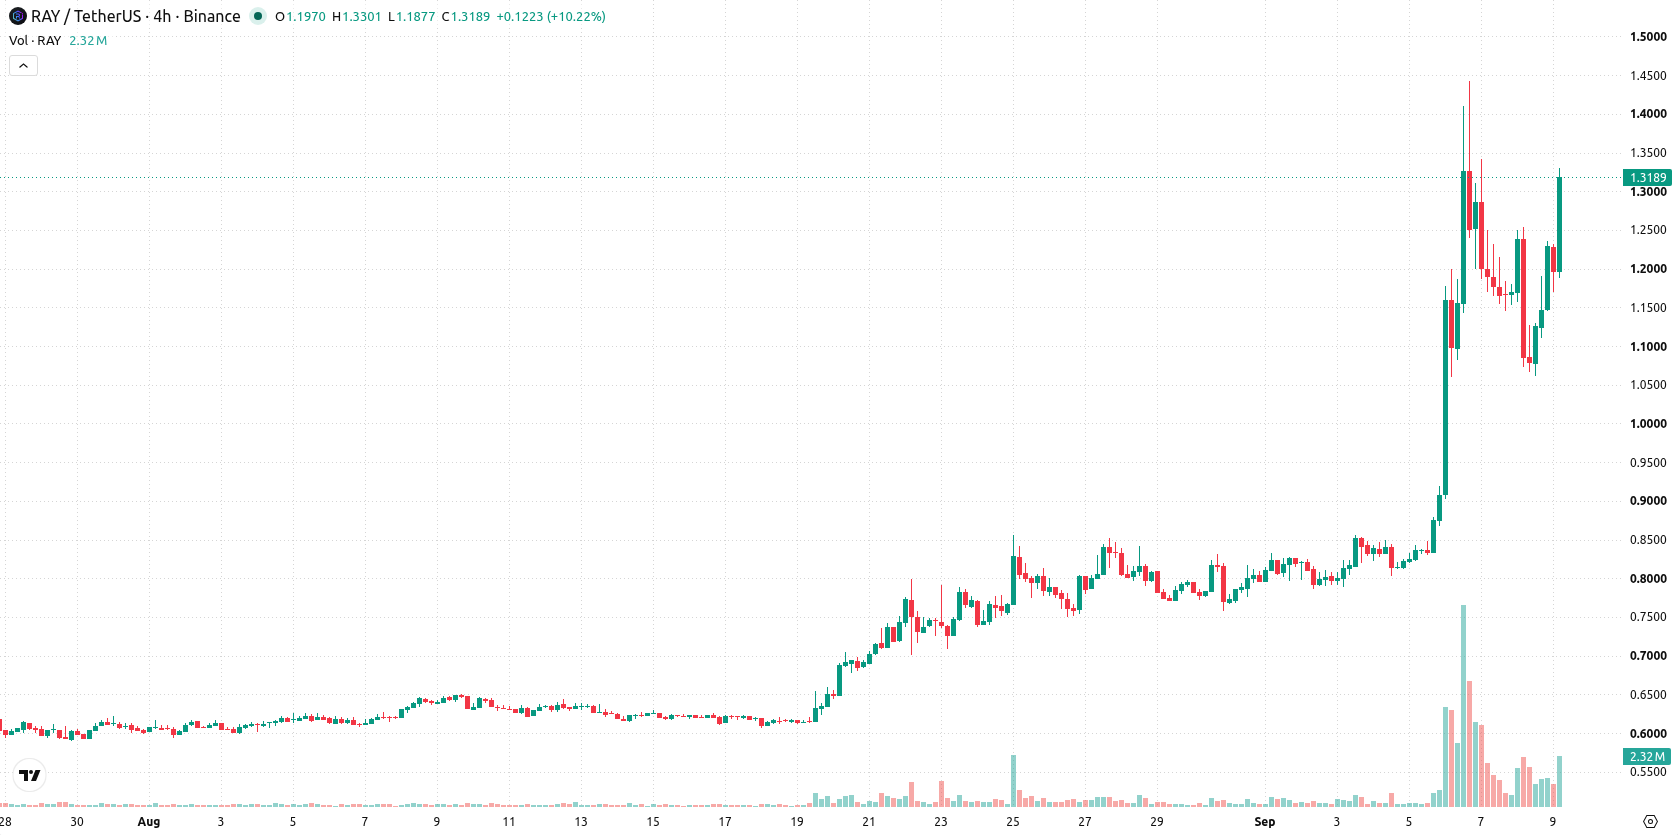
Bullish momentum consolidates above key averages as indicators stretch
RAY/USD is trading above its 20-day ($0.8547), 50-day ($0.7174), and 200-day ($0.6785) moving averages, indicating strong bullish momentum across all timeframes. The 50-day and 200-day averages remain in bullish alignment, with immediate resistance at $1.4428 and support at $1.2323. Momentum indicators such as MACD and ADX both show buy signals, with the RSI elevated at 72.79 and the CCI also reflecting overbought conditions. BBP is positive, signaling buyers are dominating intraday, while the Awesome Oscillator supports ongoing upside. However, the Stochastic RSI is neutral and the Hull Moving Average is signaling a potential pause. The pair is trading near session highs after an 11.07% upside gap, with daily volatility at 4.05%. Intraday momentum remains strong, though some oscillators point to stretched technical conditions.
Earlier, analysts noted that Raydium’s technical structure had shifted to a more neutral stance despite strong underlying fundamentals and platform improvements. The current surge in price action adds a new dimension to this view, with stretched overbought indicators making the $1.2323 support and $1.4428 resistance critical levels for traders monitoring the risk of sharp moves in either direction.





Latest Raydium News





-
 Afghanistan
-
 Albania
-
 Algeria
-
 Angola
-
 Argentina
-
 Armenia
-
 Australia
-
 Austria
-
 Azerbaijan
-
 Bahamas
-
 Bahrain
-
 Bangladesh
-
 Belarus
-
 Belgium
-
 Bolivia
-
 Botswana
-
 Brazil
-
 Brunei
-
 Bulgaria
-
 Cambodia
-
 Cameroon
-
 Canada
-
 Chile
Chile
-
 China
China
-
 Colombia
-
 Congo
Congo
-
 Costa Rica
-
 Cote d'Ivoire
-
 Croatia
-
 Cuba
Cuba
-
 Cyprus
-
 Czechia
-
 DR Congo
-
 Denmark
-
 Dominican Republic
-
 Ecuador
-
 Egypt
Egypt
-
 El Salvador
-
 Estonia
-
 Eswatini
-
 Ethiopia
-
 Finland
-
 France
-
 Georgia
-
 Germany
-
 Ghana
Ghana
-
 Greece
-
 Haiti
Haiti
-
 Hong Kong
-
 Hungary
-
 India
India
-
 Indonesia
-
 Iran, Islamic republic
-
 Iraq
Iraq
-
 Ireland
-
 Israel
-
 Italy
Italy
-
 Jamaica
-
 Japan
Japan
-
 Jordan
-
 Kazakhstan
-
 Kenya
Kenya
-
 Korea
Korea
-
 Kuwait
-
 Kyrgyzstan
-
 Laos
Laos
-
 Latvia
-
 Lebanon
-
 Lesotho
-
 Libya
Libya
-
 Lithuania
-
 Luxembourg
-
 Madagascar
-
 Malaysia
-
 Malta
Malta
-
 Mauritius
-
 Mexico
-
 Moldova
-
 Mongolia
-
 Montenegro
-
 Morocco
-
 Mozambique
-
 Myanmar
-
 Namibia
-
 Nepal
Nepal
-
 Netherlands
-
 New Zealand
-
 Nigeria
-
 North Macedonia
-
 Norway
-
 Oman
Oman
-
 Pakistan
-
 Palestine
-
 Panama
-
 Papua New Guinea
-
 Paraguay
-
 Peru
Peru
-
 Philippines
-
 Poland
-
 Portugal
-
 Puerto Rico
-
 Qatar
Qatar
-
 Reunion
-
 Romania
-
 Rwanda
-
 Saudi Arabia
-
 Serbia
-
 Singapore
-
 Slovakia
-
 Slovenia
-
 Somalia
-
 South Africa
-
 Spain
Spain
-
 Sri Lanka
-
 Sweden
-
 Switzerland
-
 Syria
Syria
-
 Taiwan
-
 Tajikistan
-
 Tanzania
-
 Thailand
-
 Trinidad and Tobago
-
 Tunisia
-
 Turkey
-
 UAE
UAE
-
 Uganda
-
 Ukraine
-
 United Kingdom
-
United States
-
 Uruguay
-
 Uzbekistan
-
 Venezuela
-
 Vietnam
-
 Yemen
Yemen
-
 Zambia
-
 Zimbabwe
- Forex
- Crypto












