

Support pressure builds: Can The Graph avoid deeper losses?

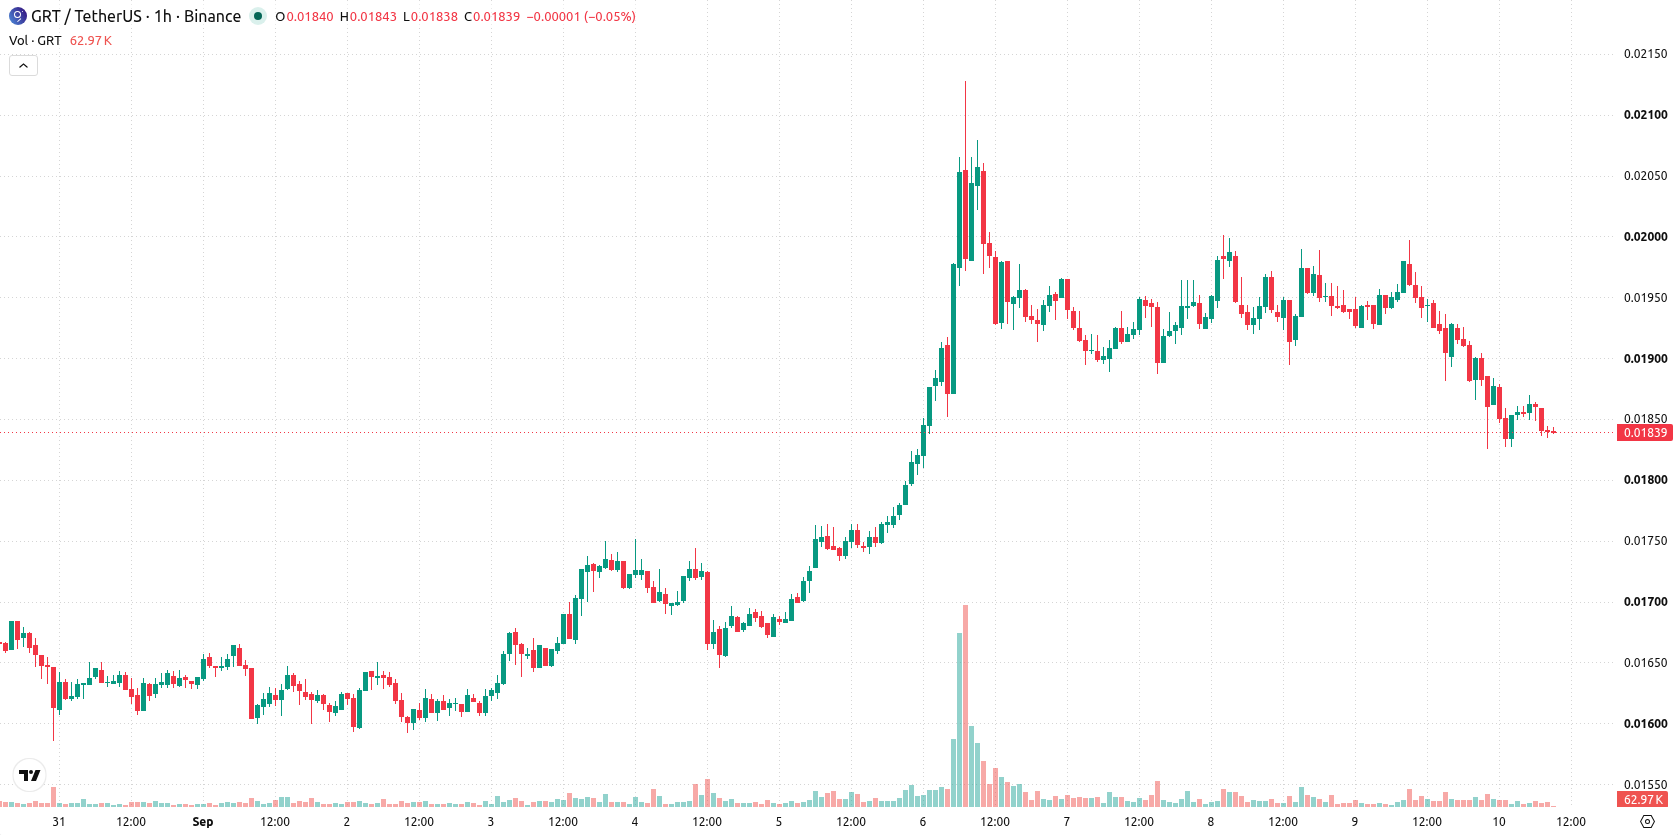
The Graph (GRT) is trading at $0.01843, posting a daily decline of 7.01%. The asset currently sits below its key moving averages, underscoring ongoing downward pressure.
 0.01711
0.01847000
Highlights
- GRT/USD trades below key moving averages across all timeframes, indicating prolonged selling pressure and bearish control.
- Momentum signals from MACD, ADX, RSI, CCI, and Bull/Bear Power are all negative, with intraday price down 7.01% and near the daily low.
- GRT/USD is projected to range between $0.01734998 and $0.01951002 in the next 2 to 3 days, with further downside more likely if $0.01735 support breaks.
Bearish technical signals intensify as sellers dominate momentum
On the technical front, GRT/USD remains under pressure as it trades below both the MA-20 ($0.0187815) and MA-50 ($0.0191914) on the h1 chart, as well as well below the long-term MA-200 ($0.021402). Immediate resistance is marked by the Ichimoku Kijun at $0.01911, while key short-term support aligns near $0.01735. Momentum indicators confirm a broad bearish bias: MACD and ADX both show Sell signals, RSI stands at 35 (Sell), and CCI also signals Sell. Stoch RSI and Awesome Oscillator remain Neutral, but Bull/Bear Power leans strongly negative. These readings point to sellers maintaining short-term dominance, with the technical picture tilted towards further weakness.
Downside risk prevails as volatility band defines outlook
In the short term, GRT/USD is expected to oscillate within a volatility band between $0.01734998 and $0.01951002 over the next two to three trading days. The probability of further downside is assessed as very high, while the likelihood of an upward rebound is minimal. The baseline scenario anticipates consolidation within this range. Should price regain strength and break above resistance at $0.01911, a bullish scenario may unfold. Conversely, a sustained break below support near $0.01735 would reinforce the prevailing negative momentum and open the door for further declines.
Earlier, analysts noted that The Graph was exhibiting mixed technical signals amid prevailing downward pressure, with traders eyeing key levels for a potential shift in trend. The latest data reinforce this bearish outlook, highlighting the importance of monitoring $0.01911 as the nearest resistance and $0.01735 as critical support for signals of a directional breakout.














-
 Afghanistan
-
 Albania
-
 Algeria
-
 Angola
-
 Argentina
-
 Armenia
-
 Australia
-
 Austria
-
 Azerbaijan
-
 Bahamas
-
 Bahrain
-
 Bangladesh
-
 Belarus
-
 Belgium
-
 Bolivia
-
 Botswana
-
 Brazil
-
 Brunei
-
 Bulgaria
-
 Cambodia
-
 Cameroon
-
 Canada
-
 Chile
-
 China
-
 Colombia
-
 Congo
-
 Costa Rica
-
 Cote d'Ivoire
-
 Croatia
-
 Cuba
-
 Cyprus
-
 Czechia
-
 DR Congo
-
 Denmark
-
 Dominican Republic
-
 Ecuador
-
 Egypt
-
 El Salvador
-
 Estonia
-
 Eswatini
-
 Ethiopia
-
 Finland
-
 France
-
 Georgia
-
 Germany
-
 Ghana
-
 Greece
-
 Haiti
-
 Hong Kong
-
 Hungary
-
 India
-
 Indonesia
-
 Iran, Islamic republic
-
 Iraq
-
 Ireland
-
 Israel
-
 Italy
-
 Jamaica
-
 Japan
-
 Jordan
-
 Kazakhstan
-
 Kenya
-
 Korea
-
 Kuwait
-
 Kyrgyzstan
-
 Laos
-
 Latvia
-
 Lebanon
-
 Lesotho
-
 Libya
-
 Lithuania
-
 Luxembourg
-
 Madagascar
-
 Malaysia
-
 Malta
-
 Mauritius
-
 Mexico
-
 Moldova
-
 Mongolia
-
 Montenegro
-
 Morocco
-
 Mozambique
-
 Myanmar
-
 Namibia
-
 Nepal
-
 Netherlands
-
 New Zealand
-
 Nigeria
-
 North Macedonia
-
 Norway
-
 Oman
-
 Pakistan
-
 Palestine
-
 Panama
-
 Papua New Guinea
-
 Paraguay
-
 Peru
-
 Philippines
-
 Poland
-
 Portugal
-
 Puerto Rico
-
 Qatar
-
 Reunion
-
 Romania
-
 Rwanda
-
 Saudi Arabia
-
 Serbia
-
 Singapore
-
 Slovakia
-
 Slovenia
-
 Somalia
-
 South Africa
-
 Spain
-
 Sri Lanka
-
 Sweden
-
 Switzerland
-
 Syria
-
 Taiwan
-
 Tajikistan
-
 Tanzania
-
 Thailand
-
 Trinidad and Tobago
-
 Tunisia
-
 Turkey
-
 UAE
-
 Uganda
-
 Ukraine
-
 United Kingdom
-
United States
-
 Uruguay
-
 Uzbekistan
-
 Venezuela
-
 Vietnam
-
 Yemen
-
 Zambia
-
 Zimbabwe
- Forex
- Crypto












