

What's behind Movement's latest 10.1% price pullback?

Movement (MOVE) dropped 10.11% in a session marked by downside volatility and persistent selling pressure. The move is supported by long-term bearish signals, as the price remains below key moving averages and trades close to near-term support.
 0.0048
0.005744
Highlights
- MOVE/USD trades below key long-term moving averages, with persistent bearish pressure and significant session losses of 10.11%.
- Momentum readings are mixed, with MACD and ADX indicating possible upside but Stochastic RSI showing oversold conditions and other signals neutral.
- Expected range for the next five sessions is $0.0073 to $0.0087, with a 62% probability of a downward move and likely sideways consolidation.
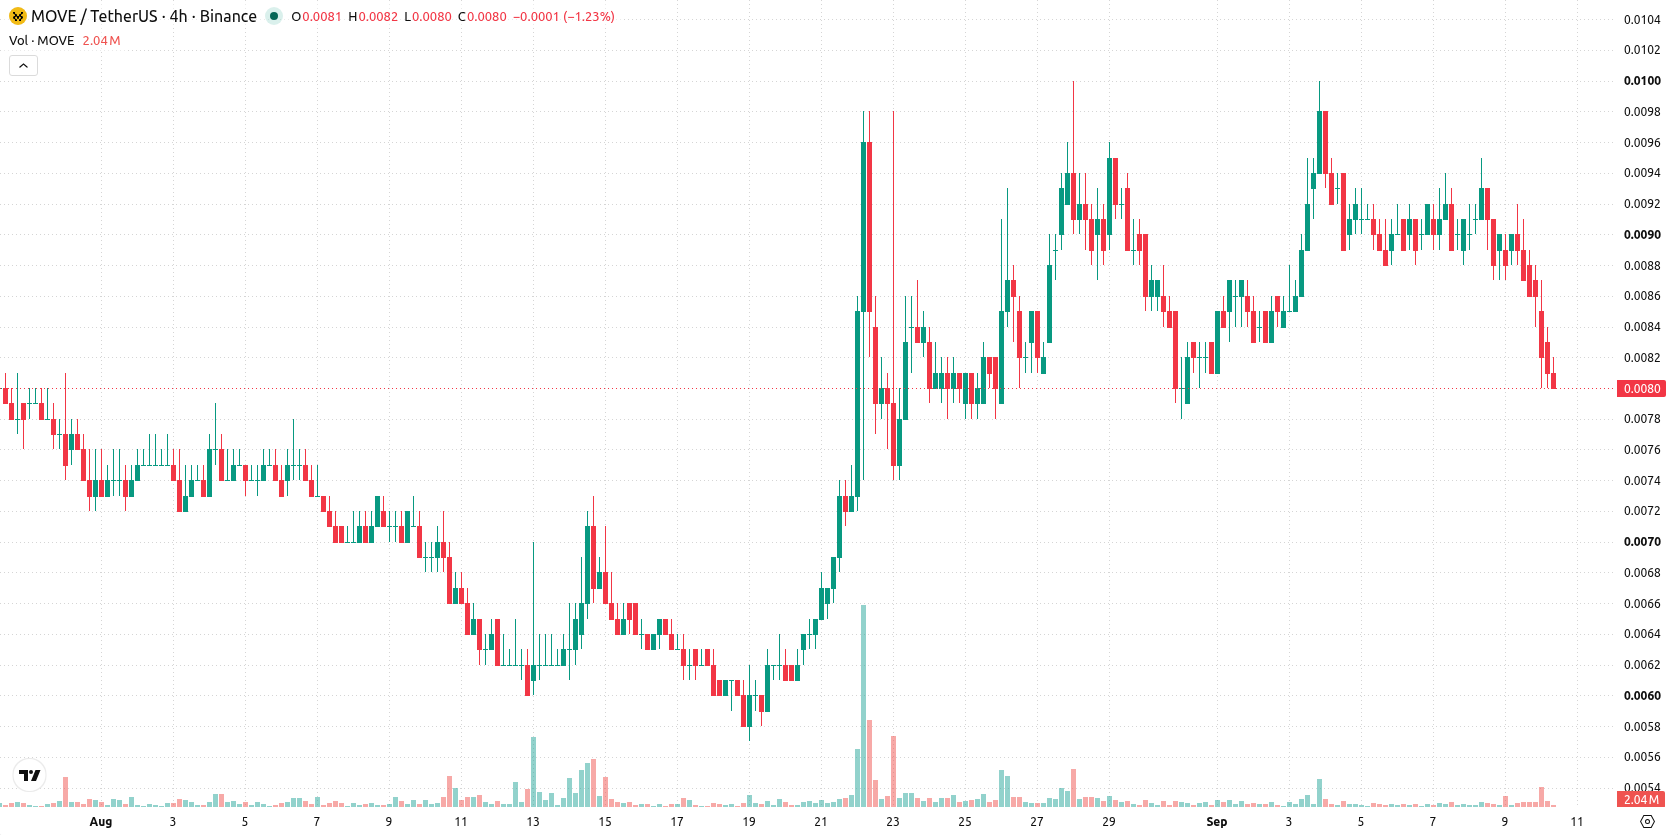
Technical divergence as mixed momentum counters persistent downtrend
MOVE/USD trades below the 20-day moving average at $0.0086 and remains far beneath the 200-day moving average at $0.0143, signaling continued long-term downward pressure. The price is above the 50-day moving average at $0.008, with immediate attention on resistance at $0.0084 and support at the Ichimoku Kijun line at $0.0079. Momentum signals are mixed: both MACD and ADX suggest further upside potential, RSI holds neutral at 51.76 but issues a buy forecast, while the Stochastic RSI highlights oversold conditions. The CCI and Awesome Oscillator remain neutral, and Bull/Bear Power (BBP) shows buyers have a slight upper hand. MOVE/USD has declined for the session, closing near the daily low with intraday volatility at 8.75%, and momentum indicators diverge from the price action.
Earlier, analysts noted that downside pressure and bearish technical signals were dominating Movement's price action. The current analysis builds on that view by highlighting mixed momentum signals and heightened volatility, making decisive moves above resistance or below support key triggers to monitor over the coming sessions.










-
 Afghanistan
-
 Albania
-
 Algeria
-
 Angola
-
 Argentina
-
 Armenia
-
 Australia
-
 Austria
-
 Azerbaijan
-
 Bahamas
-
 Bahrain
-
 Bangladesh
-
 Belarus
-
 Belgium
-
 Bolivia
-
 Botswana
-
 Brazil
-
 Brunei
-
 Bulgaria
-
 Cambodia
-
 Cameroon
-
 Canada
-
 Chile
-
 China
-
 Colombia
-
 Congo
-
 Costa Rica
-
 Cote d'Ivoire
-
 Croatia
-
 Cuba
-
 Cyprus
-
 Czechia
-
 DR Congo
-
 Denmark
-
 Dominican Republic
-
 Ecuador
-
 Egypt
-
 El Salvador
-
 Estonia
-
 Eswatini
-
 Ethiopia
-
 Finland
-
 France
-
 Georgia
-
 Germany
-
 Ghana
-
 Greece
-
 Haiti
-
 Hong Kong
-
 Hungary
-
 India
-
 Indonesia
-
 Iran, Islamic republic
-
 Iraq
-
 Ireland
-
 Israel
-
 Italy
-
 Jamaica
-
 Japan
-
 Jordan
-
 Kazakhstan
-
 Kenya
-
 Korea
-
 Kuwait
-
 Kyrgyzstan
-
 Laos
-
 Latvia
-
 Lebanon
-
 Lesotho
-
 Libya
-
 Lithuania
-
 Luxembourg
-
 Madagascar
-
 Malaysia
-
 Malta
-
 Mauritius
-
 Mexico
-
 Moldova
-
 Mongolia
-
 Montenegro
-
 Morocco
-
 Mozambique
-
 Myanmar
-
 Namibia
-
 Nepal
-
 Netherlands
-
 New Zealand
-
 Nigeria
-
 North Macedonia
-
 Norway
-
 Oman
-
 Pakistan
-
 Palestine
-
 Panama
-
 Papua New Guinea
-
 Paraguay
-
 Peru
-
 Philippines
-
 Poland
-
 Portugal
-
 Puerto Rico
-
 Qatar
-
 Reunion
-
 Romania
-
 Rwanda
-
 Saudi Arabia
-
 Serbia
-
 Singapore
-
 Slovakia
-
 Slovenia
-
 Somalia
-
 South Africa
-
 Spain
-
 Sri Lanka
-
 Sweden
-
 Switzerland
-
 Syria
-
 Taiwan
-
 Tajikistan
-
 Tanzania
-
 Thailand
-
 Trinidad and Tobago
-
 Tunisia
-
 Turkey
-
 UAE
-
 Uganda
-
 Ukraine
-
 United Kingdom
-
United States
-
 Uruguay
-
 Uzbekistan
-
 Venezuela
-
 Vietnam
-
 Yemen
-
 Zambia
-
 Zimbabwe
- Forex
- Crypto












