

Support test ahead: Can Raydium avoid deeper losses?

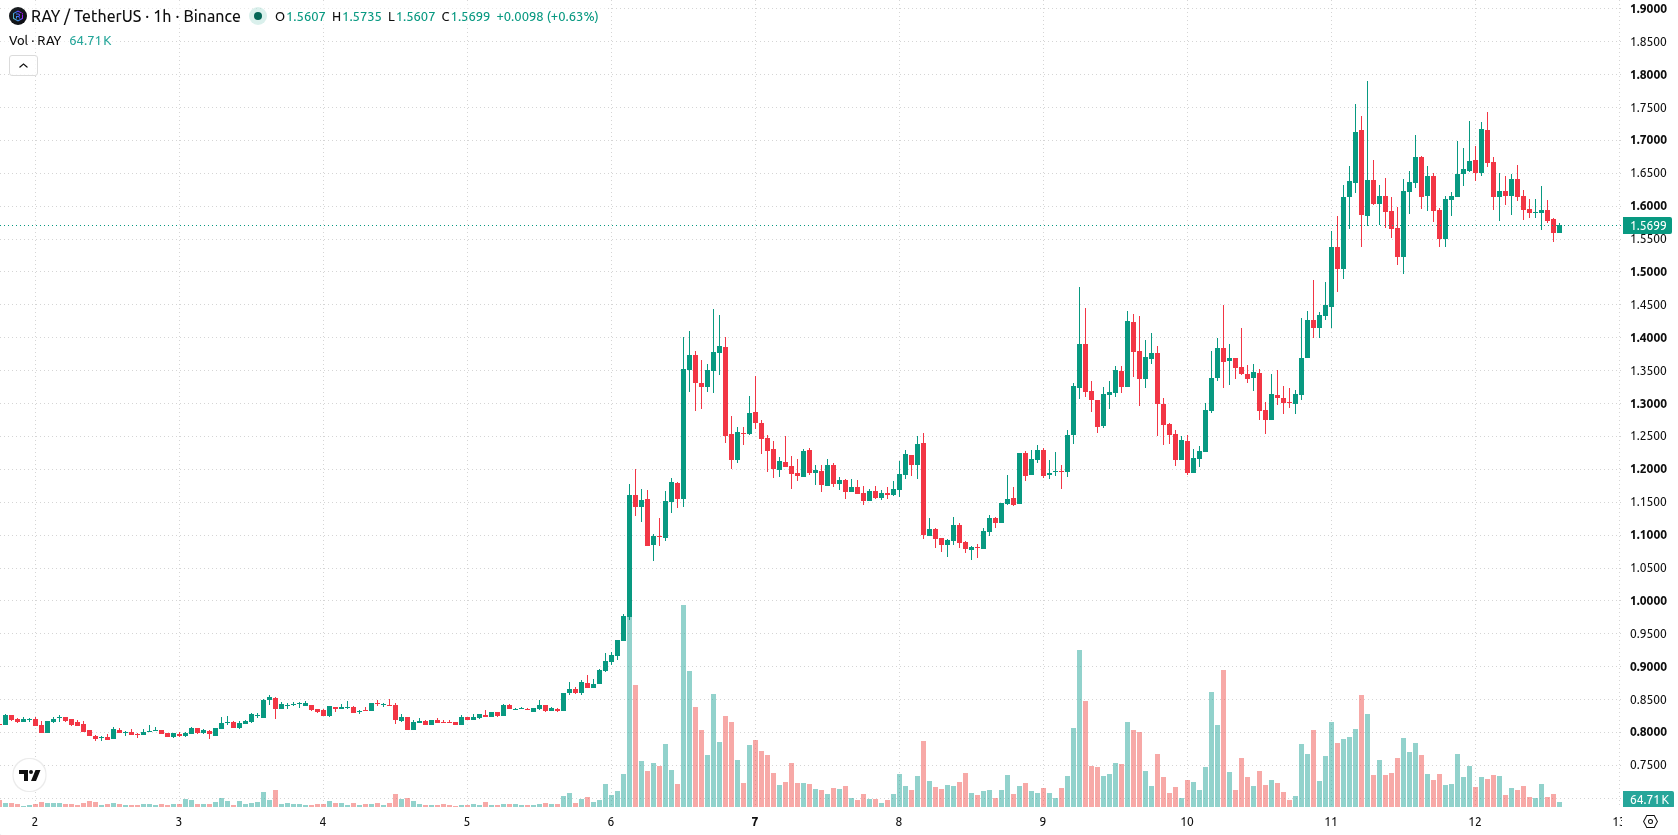
Raydium (RAY) is trading at $1.5725, down 7.25% on the day. The asset trades below its key short-term averages but remains supported by its medium- and long-term trend indicators.
 2.5199
2.5729
2.5199
2.5729
Highlights
- Raydium repurchased $640,788 in RAY tokens on September 9, raising total cumulative buybacks to $2.1 million.
- StonkFun token launches consolidated on Raydium LaunchLab have increased protocol trading volumes and fees.
- RAY/USD fell 7.25% and trades near session lows with mixed momentum signals and an expected range of $1.374 to $2.087 over the next 2 to 3 sessions.
Buyback and launch activity boost efforts as selling persists
Raydium undertook its largest-ever buyback on September 9, repurchasing $640,788 in RAY tokens and bringing total cumulative buybacks to $2.1 million, according to Coincentral. This action reduces the circulating supply and signals the deployment of protocol revenues toward tokenholder returns. In addition, the consolidation of StonkFun token launches onto Raydium’s LaunchLab has increased protocol trading volumes and fees, as reported by Themerkle. These developments suggest corporate initiatives aimed at supporting token value and ecosystem activity, though price action has remained under broader selling pressure.
Oversold momentum builds as resistance limits upside bids
RAY/USD currently trades below the MA-20 ($1.6204), while remaining above the MA-50 ($1.5503) on the H1 chart and above the MA-200 ($0.6912) on the daily chart. The Ichimoku Kijun is positioned at $1.6195 and acts as immediate resistance. The RSI is at 45.88, and both the Commodity Channel Index and Stochastic RSI sit in oversold territory, highlighting downside momentum. Bull/Bear Power readings indicate seller dominance, while the ADX suggests underlying buyer strength. Meanwhile, MACD remains neutral, and the Awesome Oscillator points lower, reflecting the day's weakness and emphasizing a volatile, two-sided market.
Sideways movement expected as breakout risk remains elevated
Over the next two to three sessions, price is expected to consolidate within the $1.374 to $2.087 range. With a 55% probability of an upward move, the baseline scenario favors continued sideways movement within this volatility band. Should RAY/USD clear immediate resistance, bullish momentum could resume, while a break below support would expose the asset to further declines.
Earlier, analysts noted that Raydium was exhibiting strong bullish momentum supported by robust on-chain activity and persistent buying pressure. The current price action marks a shift, as downside momentum and volatility characterize trading, making immediate resistance at the Ichimoku Kijun a critical level for traders to monitor over the near term.





Latest Raydium News





-
 Afghanistan
-
 Albania
-
 Algeria
-
 Angola
-
 Argentina
-
 Armenia
-
 Australia
-
 Austria
-
 Azerbaijan
-
 Bahamas
-
 Bahrain
-
 Bangladesh
-
 Belarus
-
 Belgium
-
 Bolivia
-
 Botswana
-
 Brazil
-
 Brunei
-
 Bulgaria
-
 Cambodia
-
 Cameroon
-
 Canada
-
 Chile
Chile
-
 China
China
-
 Colombia
-
 Congo
Congo
-
 Costa Rica
-
 Cote d'Ivoire
-
 Croatia
-
 Cuba
Cuba
-
 Cyprus
-
 Czechia
-
 DR Congo
-
 Denmark
-
 Dominican Republic
-
 Ecuador
-
 Egypt
Egypt
-
 El Salvador
-
 Estonia
-
 Eswatini
-
 Ethiopia
-
 Finland
-
 France
-
 Georgia
-
 Germany
-
 Ghana
Ghana
-
 Greece
-
 Haiti
Haiti
-
 Hong Kong
-
 Hungary
-
 India
India
-
 Indonesia
-
 Iran, Islamic republic
-
 Iraq
Iraq
-
 Ireland
-
 Israel
-
 Italy
Italy
-
 Jamaica
-
 Japan
Japan
-
 Jordan
-
 Kazakhstan
-
 Kenya
Kenya
-
 Korea
Korea
-
 Kuwait
-
 Kyrgyzstan
-
 Laos
Laos
-
 Latvia
-
 Lebanon
-
 Lesotho
-
 Libya
Libya
-
 Lithuania
-
 Luxembourg
-
 Madagascar
-
 Malaysia
-
 Malta
Malta
-
 Mauritius
-
 Mexico
-
 Moldova
-
 Mongolia
-
 Montenegro
-
 Morocco
-
 Mozambique
-
 Myanmar
-
 Namibia
-
 Nepal
Nepal
-
 Netherlands
-
 New Zealand
-
 Nigeria
-
 North Macedonia
-
 Norway
-
 Oman
Oman
-
 Pakistan
-
 Palestine
-
 Panama
-
 Papua New Guinea
-
 Paraguay
-
 Peru
Peru
-
 Philippines
-
 Poland
-
 Portugal
-
 Puerto Rico
-
 Qatar
Qatar
-
 Reunion
-
 Romania
-
 Rwanda
-
 Saudi Arabia
-
 Serbia
-
 Singapore
-
 Slovakia
-
 Slovenia
-
 Somalia
-
 South Africa
-
 Spain
Spain
-
 Sri Lanka
-
 Sweden
-
 Switzerland
-
 Syria
Syria
-
 Taiwan
-
 Tajikistan
-
 Tanzania
-
 Thailand
-
 Trinidad and Tobago
-
 Tunisia
-
 Turkey
-
 UAE
UAE
-
 Uganda
-
 Ukraine
-
 United Kingdom
-
United States
-
 Uruguay
-
 Uzbekistan
-
 Venezuela
-
 Vietnam
-
 Yemen
Yemen
-
 Zambia
-
 Zimbabwe
- Forex
- Crypto












