

The Graph trading range narrows with Stochastic RSI nearing oversold territory: weekly analysis

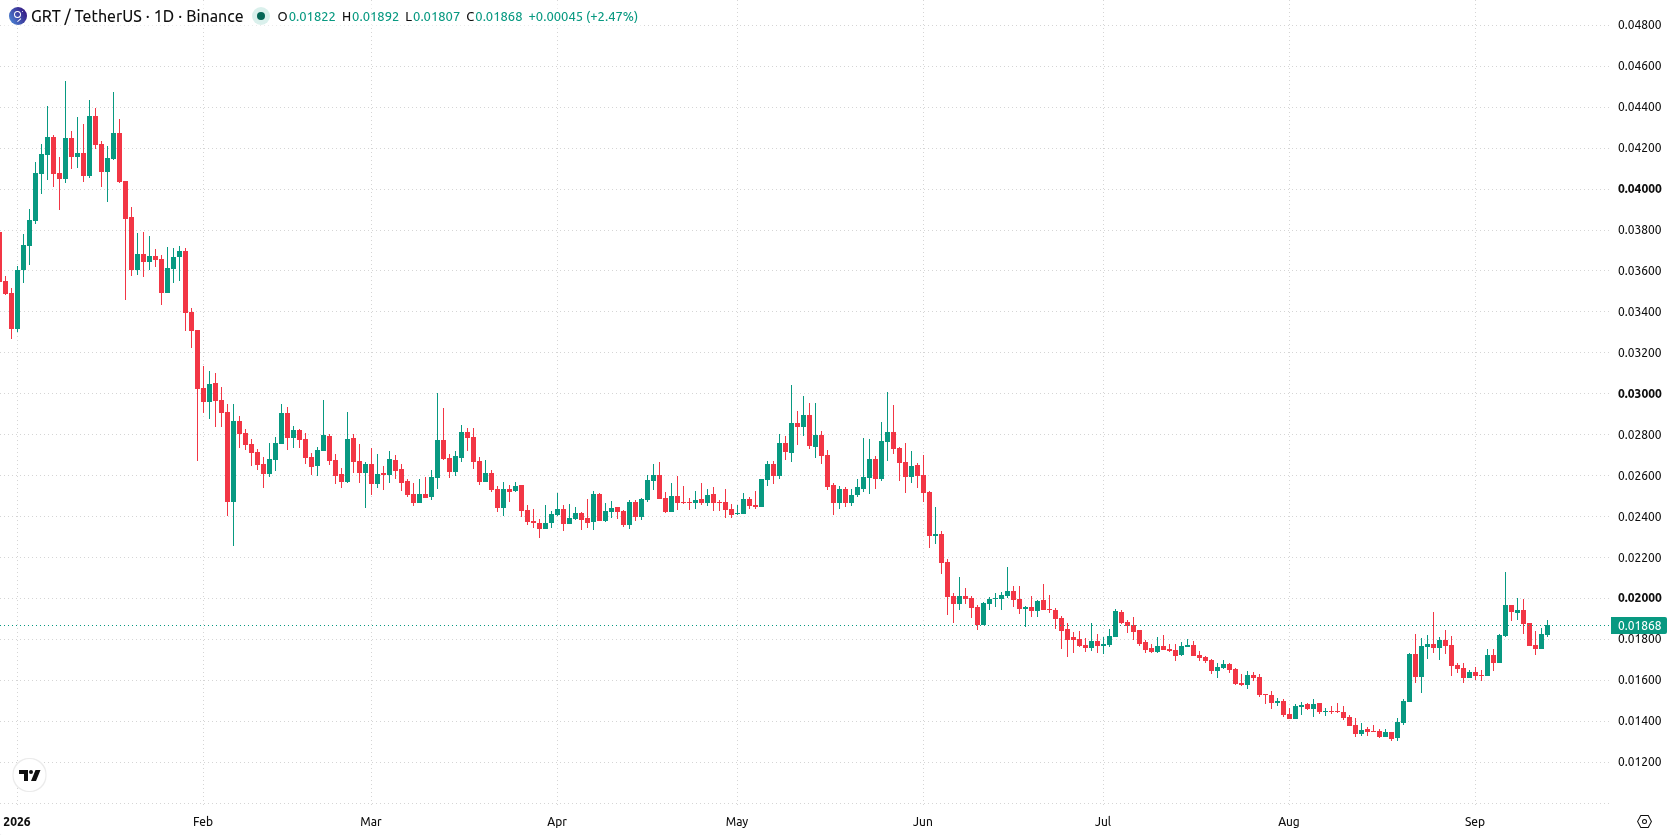
The Graph (GRT) is holding near $0.019 after sliding almost 6% over the past week, as sellers managed to sustain pressure despite the lack of a sharp breakdown. The charts point to strong buyer activity even as downside momentum wanes, keeping support levels in focus. Traders are watching whether these buyers can defend the current floor or if renewed volatility will drive a shift in trend in the days ahead.
 0.01711
0.01847000
Highlights
- The Graph trades at $0.01865, down 5.95% over the past week, with a bearish long-term price structure.
- Indicators reveal continued buyer strength, but Stochastic RSI nears oversold, hinting at slowing downside momentum.
- Expected range for the week is $0.01717367 to $0.02012632, with 76% probability of an increase and resistance at $0.02001.
Buyer momentum persists as volatility climbs and support holds
The daily setup shows a sustained move lower with a firm trend, as evidenced by the 16.2% volatility this week. MACD and Bull/Bear Power both signal continued buyer strength, while Stochastic RSI is approaching oversold, hinting at waning downside momentum but not yet reversing. Immediate support stands at $0.017603, with the Ichimoku Kijun at $0.017135 offering a nearby backup. Resistance is visible at the recent weekly high of $0.02001, capping the upper end of the current range.
Choppy range favored as risk of breakout rises next week
Over the coming week, the expected range is $0.01717367 to $0.02012632, with a 76% probability of an increase and 24% for a decrease. The base case favors further choppy trading within this band as the prevailing trend continues. A decisive move above $0.02001 would open room for bullish momentum to gather pace. A break below $0.017603, or further down to the Kijun at $0.017135, would undermine near-term support and risk deeper losses.
Earlier, analysts noted that The Graph faced persistent downward pressure, with technical signals pointing to sustained weakness. With current data indicating buyer activity is tempering the latest decline, traders should focus on whether GRT can hold above immediate support, as this could determine the next significant move.














-
 Afghanistan
-
 Albania
-
 Algeria
-
 Angola
-
 Argentina
-
 Armenia
-
 Australia
-
 Austria
-
 Azerbaijan
-
 Bahamas
-
 Bahrain
-
 Bangladesh
-
 Belarus
-
 Belgium
-
 Bolivia
-
 Botswana
-
 Brazil
-
 Brunei
-
 Bulgaria
-
 Cambodia
-
 Cameroon
-
 Canada
-
 Chile
-
 China
-
 Colombia
-
 Congo
-
 Costa Rica
-
 Cote d'Ivoire
-
 Croatia
-
 Cuba
-
 Cyprus
-
 Czechia
-
 DR Congo
-
 Denmark
-
 Dominican Republic
-
 Ecuador
-
 Egypt
-
 El Salvador
-
 Estonia
-
 Eswatini
-
 Ethiopia
-
 Finland
-
 France
-
 Georgia
-
 Germany
-
 Ghana
-
 Greece
-
 Haiti
-
 Hong Kong
-
 Hungary
-
 India
-
 Indonesia
-
 Iran, Islamic republic
-
 Iraq
-
 Ireland
-
 Israel
-
 Italy
-
 Jamaica
-
 Japan
-
 Jordan
-
 Kazakhstan
-
 Kenya
-
 Korea
-
 Kuwait
-
 Kyrgyzstan
-
 Laos
-
 Latvia
-
 Lebanon
-
 Lesotho
-
 Libya
-
 Lithuania
-
 Luxembourg
-
 Madagascar
-
 Malaysia
-
 Malta
-
 Mauritius
-
 Mexico
-
 Moldova
-
 Mongolia
-
 Montenegro
-
 Morocco
-
 Mozambique
-
 Myanmar
-
 Namibia
-
 Nepal
-
 Netherlands
-
 New Zealand
-
 Nigeria
-
 North Macedonia
-
 Norway
-
 Oman
-
 Pakistan
-
 Palestine
-
 Panama
-
 Papua New Guinea
-
 Paraguay
-
 Peru
-
 Philippines
-
 Poland
-
 Portugal
-
 Puerto Rico
-
 Qatar
-
 Reunion
-
 Romania
-
 Rwanda
-
 Saudi Arabia
-
 Serbia
-
 Singapore
-
 Slovakia
-
 Slovenia
-
 Somalia
-
 South Africa
-
 Spain
-
 Sri Lanka
-
 Sweden
-
 Switzerland
-
 Syria
-
 Taiwan
-
 Tajikistan
-
 Tanzania
-
 Thailand
-
 Trinidad and Tobago
-
 Tunisia
-
 Turkey
-
 UAE
-
 Uganda
-
 Ukraine
-
 United Kingdom
-
United States
-
 Uruguay
-
 Uzbekistan
-
 Venezuela
-
 Vietnam
-
 Yemen
-
 Zambia
-
 Zimbabwe
- Forex
- Crypto












