

Raydium price tests $1.3275 support as sellers dominate intraday action

Raydium (RAY) is trading at $1.49, marking a daily decline of 7.02%. The asset remains below its key short- and medium-term moving averages but above the longer-term threshold.
 1.4648
1.6758
Highlights
- Raydium executed significant token buybacks recently, directly lowering circulating supply and making tokens more scarce.
- The addition of Stonkfun to Raydium broadened its launchpad offerings, supporting increased ecosystem activity and user participation.
- RAY/USD faces short- and medium-term selling pressure, with price forecast to trade between $1.3275 and $1.7686 and downward moves more likely.
Token buybacks and product expansion challenge market’s selling pressure
Raydium executed major token buybacks in recent weeks, an on-chain action that directly reduced circulating supply and increased relative scarcity, as reported by Thecoinrepublic. In parallel, the integration of Stonkfun with Raydium's launchpad broadened the protocol's product suite, likely encouraging greater user participation and activity across the ecosystem. Both developments have the potential to enhance token value, though price action has remained under broader selling pressure.
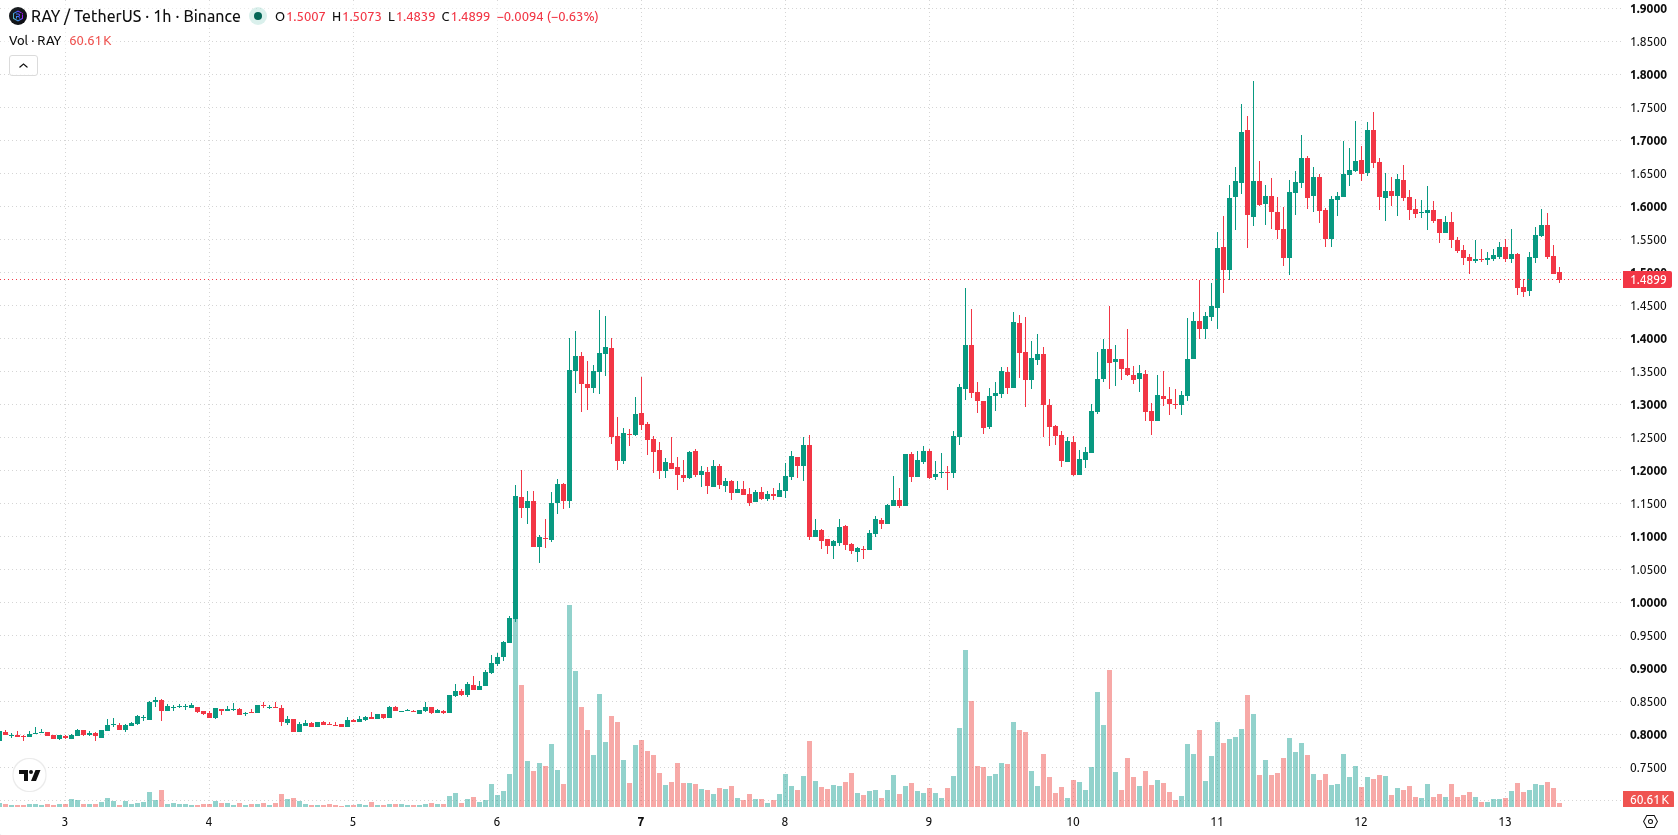
Technical resistance and mixed momentum signal fragile market balance
On the h1 timeframe, RAY/USD is positioned below the MA-20 and MA-50 but above the MA-200. The Ichimoku Kijun at $1.5621 acts as immediate resistance. MACD signals strong sell momentum, while the ADX remains neutral, indicating a lack of clear directional strength. The RSI stands at 45, pointing toward a sell reading; both Stochastic RSI and CCI show neutral conditions. Bull/Bear Power, however, indicates intraday buyer activity despite the overall price drop, highlighting internal divergence.
Sideways bias likely as downside risk outweighs bullish scenario
Looking ahead to the next 2–3 trading days, RAY/USD is expected to fluctuate between $1.3275 and $1.7686, representing a typical short-term volatility band. Model probabilities assign a 28% chance to an upward move, with downside momentum more likely dominating in the near term. The baseline scenario anticipates sideways trading within this corridor; a break above the Kijun level would shift the outlook bullish, while a move below $1.3275 would confirm renewed selling momentum.
Earlier, analysts noted that Raydium’s strong ecosystem developments and token buybacks were offset by persistent market volatility and mixed technical signals, suggesting a period of broad sideways activity. The current analysis reinforces this view, highlighting the importance of the $1.3275 support level as a potential trigger for renewed downside momentum in the days ahead.










-
 Afghanistan
-
 Albania
-
 Algeria
-
 Angola
-
 Argentina
-
 Armenia
-
 Australia
-
 Austria
-
 Azerbaijan
-
 Bahamas
-
 Bahrain
-
 Bangladesh
-
 Belarus
-
 Belgium
-
 Bolivia
-
 Botswana
-
 Brazil
-
 Brunei
-
 Bulgaria
-
 Cambodia
-
 Cameroon
-
 Canada
-
 Chile
-
 China
-
 Colombia
-
 Congo
-
 Costa Rica
-
 Cote d'Ivoire
-
 Croatia
-
 Cuba
-
 Cyprus
-
 Czechia
-
 DR Congo
-
 Denmark
-
 Dominican Republic
-
 Ecuador
-
 Egypt
-
 El Salvador
-
 Estonia
-
 Eswatini
-
 Ethiopia
-
 Finland
-
 France
-
 Georgia
-
 Germany
-
 Ghana
-
 Greece
-
 Haiti
-
 Hong Kong
-
 Hungary
-
 India
-
 Indonesia
-
 Iran, Islamic republic
-
 Iraq
-
 Ireland
-
 Israel
-
 Italy
-
 Jamaica
-
 Japan
-
 Jordan
-
 Kazakhstan
-
 Kenya
-
 Korea
-
 Kuwait
-
 Kyrgyzstan
-
 Laos
-
 Latvia
-
 Lebanon
-
 Lesotho
-
 Libya
-
 Lithuania
-
 Luxembourg
-
 Madagascar
-
 Malaysia
-
 Malta
-
 Mauritius
-
 Mexico
-
 Moldova
-
 Mongolia
-
 Montenegro
-
 Morocco
-
 Mozambique
-
 Myanmar
-
 Namibia
-
 Nepal
-
 Netherlands
-
 New Zealand
-
 Nigeria
-
 North Macedonia
-
 Norway
-
 Oman
-
 Pakistan
-
 Palestine
-
 Panama
-
 Papua New Guinea
-
 Paraguay
-
 Peru
-
 Philippines
-
 Poland
-
 Portugal
-
 Puerto Rico
-
 Qatar
-
 Reunion
-
 Romania
-
 Rwanda
-
 Saudi Arabia
-
 Serbia
-
 Singapore
-
 Slovakia
-
 Slovenia
-
 Somalia
-
 South Africa
-
 Spain
-
 Sri Lanka
-
 Sweden
-
 Switzerland
-
 Syria
-
 Taiwan
-
 Tajikistan
-
 Tanzania
-
 Thailand
-
 Trinidad and Tobago
-
 Tunisia
-
 Turkey
-
 UAE
-
 Uganda
-
 Ukraine
-
 United Kingdom
-
United States
-
 Uruguay
-
 Uzbekistan
-
 Venezuela
-
 Vietnam
-
 Yemen
-
 Zambia
-
 Zimbabwe
- Forex
- Crypto












