

What's behind Raydium's latest 9.4% price pullback?

Raydium (RAY) fell 9.43% as intraday volatility surged and sellers drove a sharp pullback following strong profit taking, even as recent major corporate actions saw a significant token buyback and product expansion. The correction is limited by a robust bullish structure, with RAY trading above its 20-day, 50-day, and 200-day moving averages, but extreme overbought conditions reinforce near-term downside risks.
 2.5199
2.5729
2.5199
2.5729
Highlights
- Raydium transaction volumes and protocol fees grew after StonkFun routed all new token launches through its LaunchLab.
- Raydium completed its largest single-day buyback on September 9, purchasing $640,788 worth of RAY tokens using 12% of protocol fees.
- RAY/USD trades in a bullish structure but faces extreme overbought indicators, with a projected five-day range of $1.2227 to $2.0894 and high volatility.
Token buyback and equity launches lift activity amid selling pressure
Raydium was affected by recent developments, including StonkFun’s move to route all new token launches through Raydium’s LaunchLab, resulting in increased trading volumes and protocol fees. On September 9, the largest single-day buyback was executed with $640,788 worth of RAY tokens purchased using 12% of protocol fees. The protocol also expanded its ecosystem by launching tokenized versions of over 15 US equities, increasing on-chain activity and reducing circulating supply, though price action has remained under broader selling pressure.
Persistent momentum meets resistance as indicators flash overbought risks
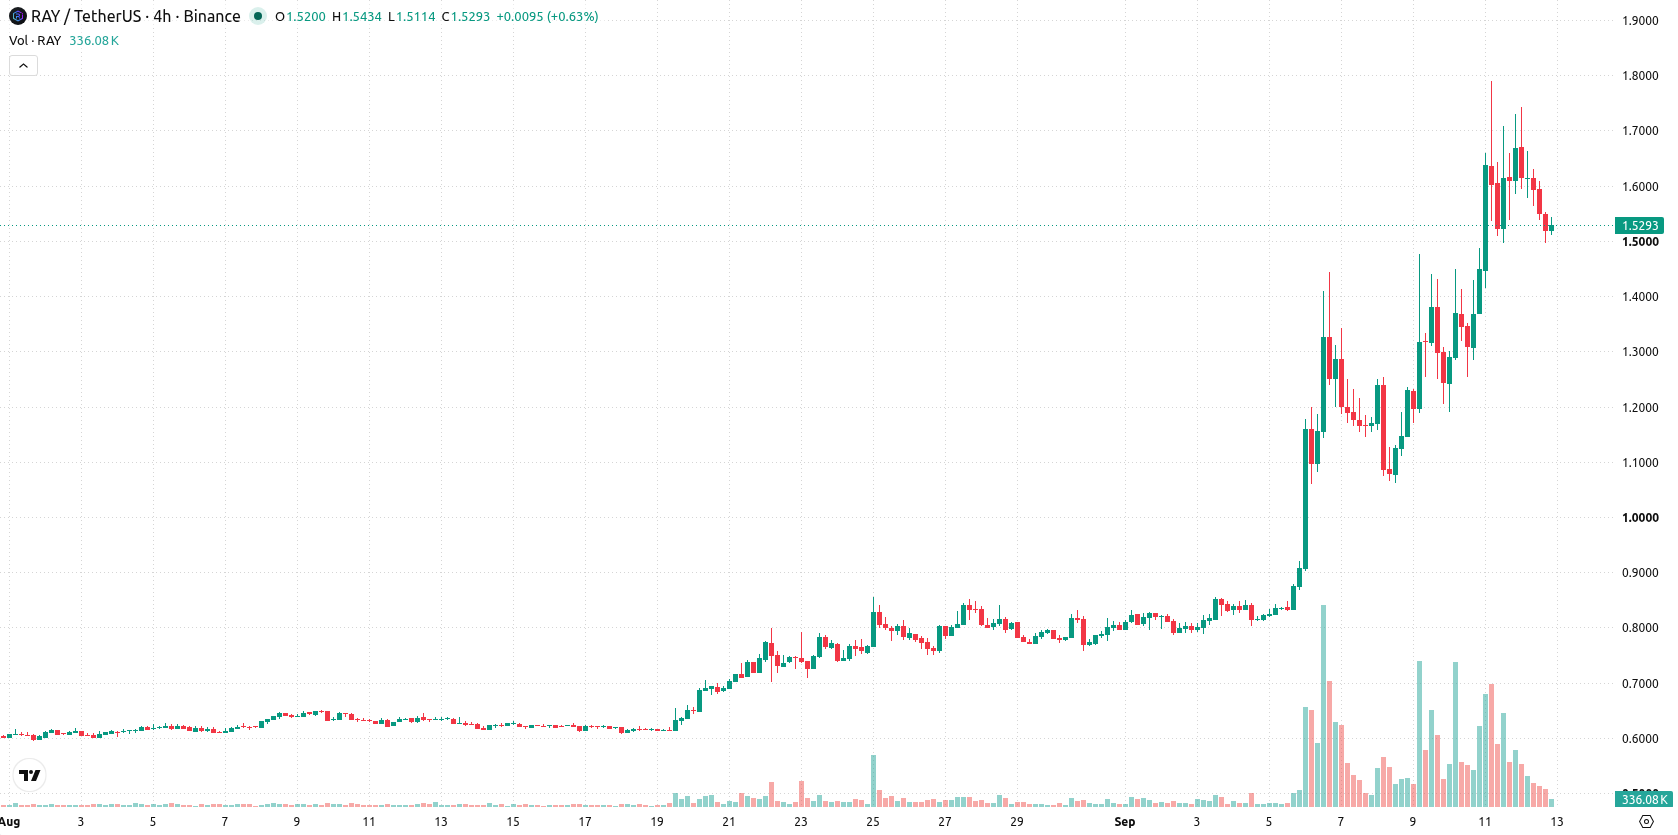
RAY/USD is trading above its 20-day, 50-day, and 200-day moving averages ($0.9644, $0.7643, $0.6912), reinforcing a bullish structure across all observed timeframes. The nearest support is at the near-term floor of $1.4969, with immediate resistance at the near-term ceiling of $1.743. Momentum signals are strong, with the Moving Average Convergence Divergence (MACD) and Average Directional Index (ADX) both forecasting continued buying strength. The Relative Strength Index (RSI), Commodity Channel Index (CCI), and Stochastic RSI all flag extreme overbought conditions. Bull/Bear Power (BBP) at 0.6486 confirms robust buyer dominance and also signals overbought territory. The Awesome Oscillator further aligns with persistent upward pressure. On the session, RAY/USD stands at $1.5284 after falling $0.1592 or 9.43%, opening with a downside gap of about $0.0184 (–1.09%). The price is near the session low and intraday volatility stands at 16.44%. Intraday dynamics reflect profit taking after an extended advance, with sellers pressing the price toward session lows in high volatility.
Earlier, analysts noted that Raydium was experiencing heightened volatility and two-sided market activity as sellers maintained pressure despite underpinning corporate initiatives. The latest developments reinforce this outlook, with the current structure signaling sideways movement within a wide band, while a decisive break above $1.743 or below $1.4969 could set the next directional move for RAY.





Latest Raydium News





-
 Afghanistan
-
 Albania
-
 Algeria
-
 Angola
-
 Argentina
-
 Armenia
-
 Australia
-
 Austria
-
 Azerbaijan
-
 Bahamas
-
 Bahrain
-
 Bangladesh
-
 Belarus
-
 Belgium
-
 Bolivia
-
 Botswana
-
 Brazil
-
 Brunei
-
 Bulgaria
-
 Cambodia
-
 Cameroon
-
 Canada
-
 Chile
Chile
-
 China
China
-
 Colombia
-
 Congo
Congo
-
 Costa Rica
-
 Cote d'Ivoire
-
 Croatia
-
 Cuba
Cuba
-
 Cyprus
-
 Czechia
-
 DR Congo
-
 Denmark
-
 Dominican Republic
-
 Ecuador
-
 Egypt
Egypt
-
 El Salvador
-
 Estonia
-
 Eswatini
-
 Ethiopia
-
 Finland
-
 France
-
 Georgia
-
 Germany
-
 Ghana
Ghana
-
 Greece
-
 Haiti
Haiti
-
 Hong Kong
-
 Hungary
-
 India
India
-
 Indonesia
-
 Iran, Islamic republic
-
 Iraq
Iraq
-
 Ireland
-
 Israel
-
 Italy
Italy
-
 Jamaica
-
 Japan
Japan
-
 Jordan
-
 Kazakhstan
-
 Kenya
Kenya
-
 Korea
Korea
-
 Kuwait
-
 Kyrgyzstan
-
 Laos
Laos
-
 Latvia
-
 Lebanon
-
 Lesotho
-
 Libya
Libya
-
 Lithuania
-
 Luxembourg
-
 Madagascar
-
 Malaysia
-
 Malta
Malta
-
 Mauritius
-
 Mexico
-
 Moldova
-
 Mongolia
-
 Montenegro
-
 Morocco
-
 Mozambique
-
 Myanmar
-
 Namibia
-
 Nepal
Nepal
-
 Netherlands
-
 New Zealand
-
 Nigeria
-
 North Macedonia
-
 Norway
-
 Oman
Oman
-
 Pakistan
-
 Palestine
-
 Panama
-
 Papua New Guinea
-
 Paraguay
-
 Peru
Peru
-
 Philippines
-
 Poland
-
 Portugal
-
 Puerto Rico
-
 Qatar
Qatar
-
 Reunion
-
 Romania
-
 Rwanda
-
 Saudi Arabia
-
 Serbia
-
 Singapore
-
 Slovakia
-
 Slovenia
-
 Somalia
-
 South Africa
-
 Spain
Spain
-
 Sri Lanka
-
 Sweden
-
 Switzerland
-
 Syria
Syria
-
 Taiwan
-
 Tajikistan
-
 Tanzania
-
 Thailand
-
 Trinidad and Tobago
-
 Tunisia
-
 Turkey
-
 UAE
UAE
-
 Uganda
-
 Ukraine
-
 United Kingdom
-
United States
-
 Uruguay
-
 Uzbekistan
-
 Venezuela
-
 Vietnam
-
 Yemen
Yemen
-
 Zambia
-
 Zimbabwe
- Forex
- Crypto












