

The Graph technical analysis: Resistance test at $0.01892759

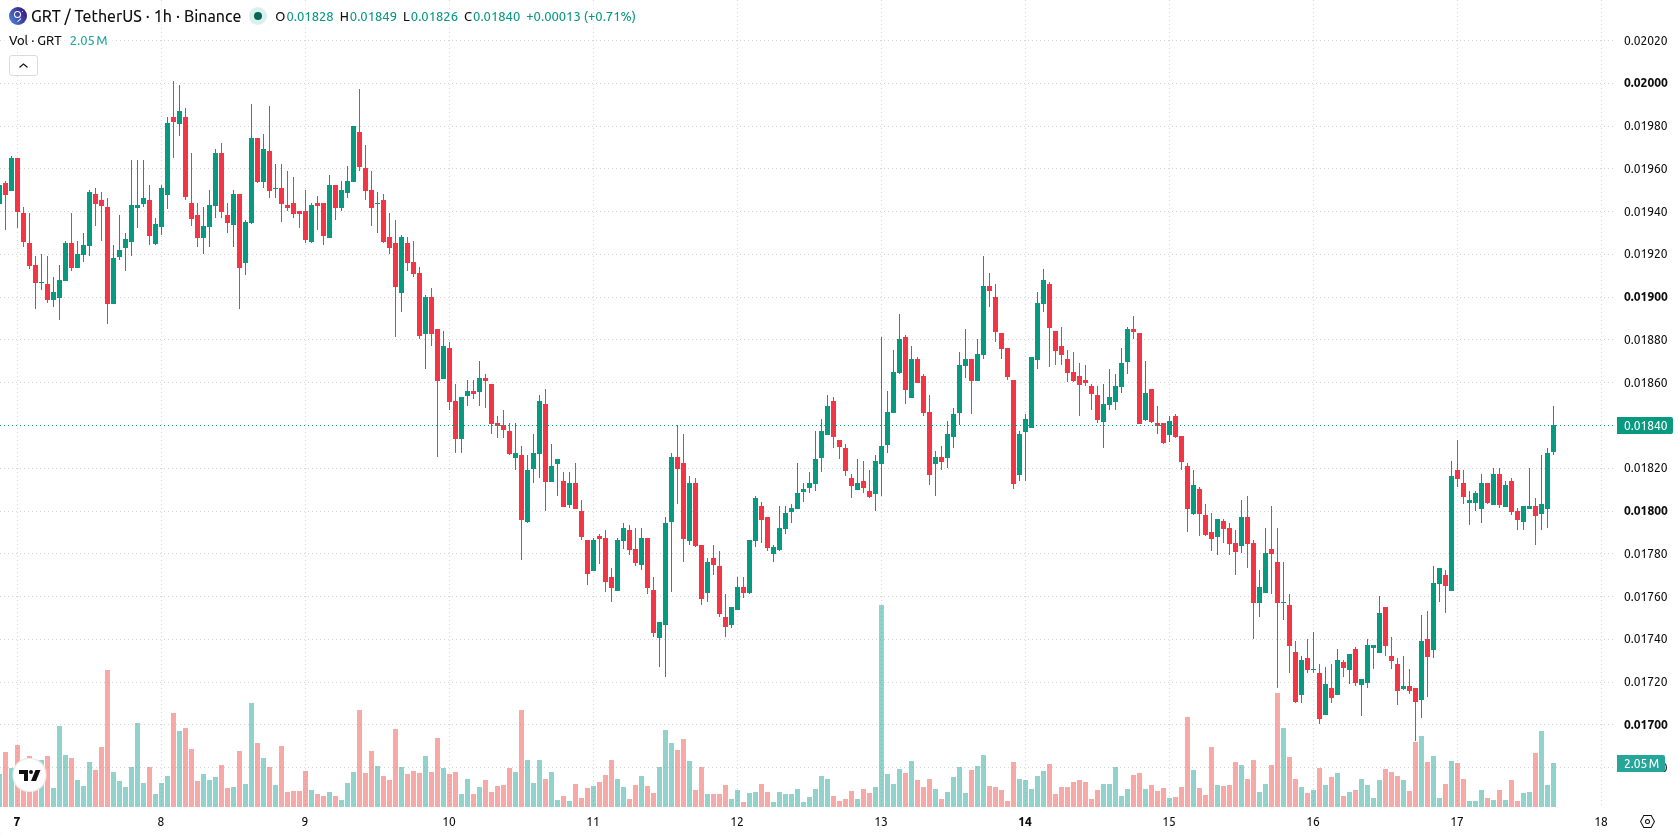
The Graph (GRT) is trading at $0.01842, showing a daily gain of 6.84%. The price currently sits above its key moving averages on the hourly chart but remains constrained by longer-term pressures.
 0.01711
0.01847000
Highlights
- GRT/USD has advanced 6.84% to $0.01842 with intraday momentum remaining positive and moderate volatility present.
- The short- and medium-term trend is upward, but the price remains under long-term selling pressure below the daily MA-200.
- For the next two to three sessions, price is expected to range between $0.01755 and $0.01892759 with a very high probability of further upside.
Bullish momentum faces resistance as neutral signals temper upside
On the technical front, GRT has advanced above its MA-20 and MA-50 on the H1 timeframe, suggesting recent upward momentum at the intraday level. However, on the daily chart, the price remains below the MA-200, which signals lingering seller influence on the broader trend. The Ichimoku Kijun level at $0.017625 serves as immediate support. MACD confirms strong bullish momentum, while the ADX reading remains neutral. Among oscillators, RSI generates a mild buy signal, Stoch RSI is in oversold territory, and CCI is neutral, reflecting a mixed short-term signal set. Bull/Bear Power indicates that buyers are asserting themselves intraday, whereas the Awesome Oscillator is neutral and does not confirm the current price move.
High upside odds as technicals favor range-bound continuation
In the near term, GRT is expected to trade within a range of $0.01755 to $0.01892759 over the next two to three sessions, consistent with typical volatility for the asset. The probability of an upward continuation remains very high given the current technical setup, while the likelihood of a downside breakdown is considered very low. Key scenarios include stabilization between immediate support and resistance, a bullish extension above the projected upper bound, or a bearish move if the price falls and holds below the Ichimoku Kijun support.
Earlier, analysts noted that buyer activity was starting to temper persistent downside pressure on The Graph, with a focus on whether support could hold. The current technical setup strengthens this view with fresh evidence of short-term bullish momentum, making the $0.017625 Ichimoku Kijun support a pivotal level to watch for potential direction in the coming sessions.













-
 Afghanistan
-
 Albania
-
 Algeria
-
 Angola
-
 Argentina
-
 Armenia
-
 Australia
-
 Austria
-
 Azerbaijan
-
 Bahamas
-
 Bahrain
-
 Bangladesh
-
 Belarus
-
 Belgium
-
 Bolivia
-
 Botswana
-
 Brazil
-
 Brunei
-
 Bulgaria
-
 Cambodia
-
 Cameroon
-
 Canada
-
 Chile
-
 China
-
 Colombia
-
 Congo
-
 Costa Rica
-
 Cote d'Ivoire
-
 Croatia
-
 Cuba
-
 Cyprus
-
 Czechia
-
 DR Congo
-
 Denmark
-
 Dominican Republic
-
 Ecuador
-
 Egypt
-
 El Salvador
-
 Estonia
-
 Eswatini
-
 Ethiopia
-
 Finland
-
 France
-
 Georgia
-
 Germany
-
 Ghana
-
 Greece
-
 Haiti
-
 Hong Kong
-
 Hungary
-
 India
-
 Indonesia
-
 Iran, Islamic republic
-
 Iraq
-
 Ireland
-
 Israel
-
 Italy
-
 Jamaica
-
 Japan
-
 Jordan
-
 Kazakhstan
-
 Kenya
-
 Korea
-
 Kuwait
-
 Kyrgyzstan
-
 Laos
-
 Latvia
-
 Lebanon
-
 Lesotho
-
 Libya
-
 Lithuania
-
 Luxembourg
-
 Madagascar
-
 Malaysia
-
 Malta
-
 Mauritius
-
 Mexico
-
 Moldova
-
 Mongolia
-
 Montenegro
-
 Morocco
-
 Mozambique
-
 Myanmar
-
 Namibia
-
 Nepal
-
 Netherlands
-
 New Zealand
-
 Nigeria
-
 North Macedonia
-
 Norway
-
 Oman
-
 Pakistan
-
 Palestine
-
 Panama
-
 Papua New Guinea
-
 Paraguay
-
 Peru
-
 Philippines
-
 Poland
-
 Portugal
-
 Puerto Rico
-
 Qatar
-
 Reunion
-
 Romania
-
 Rwanda
-
 Saudi Arabia
-
 Serbia
-
 Singapore
-
 Slovakia
-
 Slovenia
-
 Somalia
-
 South Africa
-
 Spain
-
 Sri Lanka
-
 Sweden
-
 Switzerland
-
 Syria
-
 Taiwan
-
 Tajikistan
-
 Tanzania
-
 Thailand
-
 Trinidad and Tobago
-
 Tunisia
-
 Turkey
-
 UAE
-
 Uganda
-
 Ukraine
-
 United Kingdom
-
United States
-
 Uruguay
-
 Uzbekistan
-
 Venezuela
-
 Vietnam
-
 Yemen
-
 Zambia
-
 Zimbabwe
- Forex
- Crypto












