

Solana technical analysis: Rally eyes $116.01 resistance after institutional ETF flow

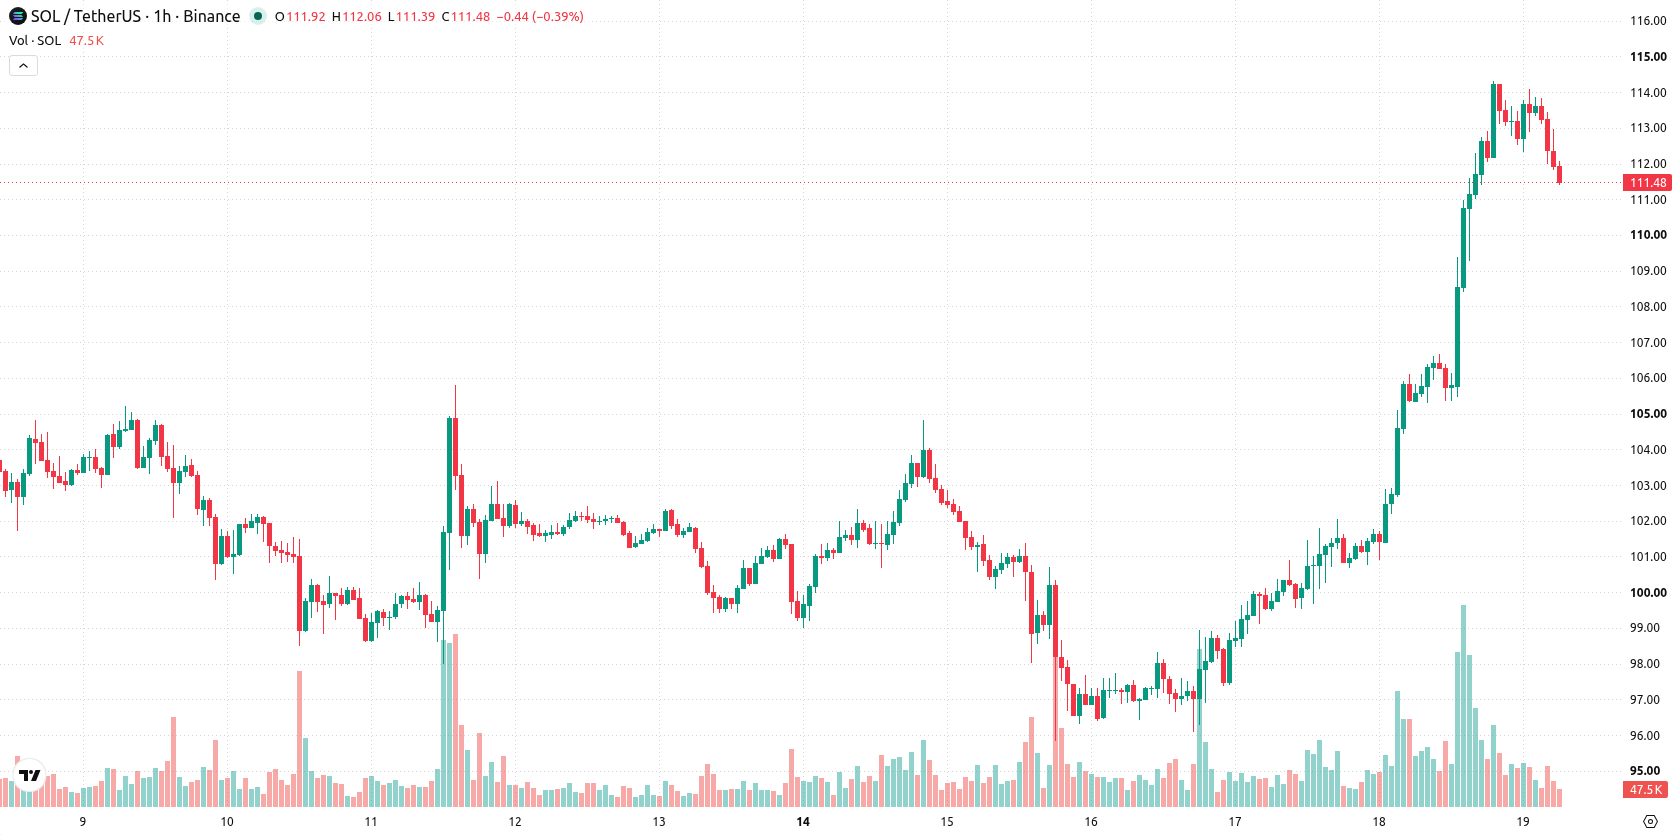
Solana (SOL) is trading at $111.87, up 6.1% on the day. The asset remains above its key moving averages, indicating ongoing strength across trend horizons.
 113.4
122.00
113.4
122.00
Highlights
- Solana upgraded its network by reducing target slot time to 250 milliseconds, increasing block production and responsiveness.
- The SEC granted a five-year exemption for blockchain-based trading of tokenized stocks, positioning Solana for securities market exposure and institutional use, with Solana-based ETFs holding $1.38 billion in net assets.
- SOL trades in a bullish technical structure with expected consolidation in the $107.73 to $116.01 range over the next one to two days.
Network upgrade and SEC exemption boost adoption and institutional flows
Solana’s recent network upgrade on September 18, 2026, improved block production speed by lowering its target slot time from 300 to 250 milliseconds, enhancing platform responsiveness and supporting greater adoption by developers and users, according to Coindesk. Regulatory developments also played a role, as Finance Yahoo reported that the SEC granted a conditional five-year exemption for blockchain-based trading of tokenized stocks, with Solana positioned as a potential beneficiary, widening its prospective use in securities markets. Institutional activity underpins these trends, with Coin Turk noting that Solana-based exchange-traded funds reached $1.38 billion in net assets. Elevated trading volume and market capitalization further reflect increased participation, as reported by Cryptoticker.
Mixed momentum readings with technical support signaling persistent uncertainty
On the hourly chart, SOL trades above the 20-period moving average at $111.53 and the 50-period at $105.82, while the 200-period moving average on the daily chart stands at $83.59. The Ichimoku Kijun on the daily timeframe is at $109.37, serving as immediate support. Momentum signals are mixed: MACD signals strong buy and ADX shows buy, both pointing to ongoing strength, while RSI sits at 66.56. However, the Stochastic RSI is oversold, CCI is neutral, and Bull/Bear Power leans higher, with the Awesome Oscillator providing a neutral reading. This divergence between momentum indicators and the Stochastic RSI highlights lingering uncertainty around the sustainability of the recent move.
Consolidation likely before potential breakout on bullish momentum
For the next one to two trading days, SOL is likely to see consolidation between $107.73 and $116.01, with a 75% probability of an upward move. The baseline scenario is for price action to remain within this band. Should bullish momentum intensify, a breakout above resistance may trigger a test of the upper range, while a drop below immediate support could expose SOL to a deeper retracement.
Earlier, analysts noted that evolving U.S. regulatory flexibility and liquidity conditions were supportive for the broader crypto sector with particular technical interest in assets like Solana alongside Bitcoin and Ethereum. With current technical signals and institutional inflows aligning with these themes, traders should monitor the $116.01 resistance for a potential breakout or watch for sustained consolidation within the prevailing short-term range.










-
 Afghanistan
-
 Albania
-
 Algeria
-
 Angola
-
 Argentina
-
 Armenia
-
 Australia
-
 Austria
-
 Azerbaijan
-
 Bahamas
-
 Bahrain
-
 Bangladesh
-
 Belarus
-
 Belgium
-
 Bolivia
-
 Botswana
-
 Brazil
-
 Brunei
-
 Bulgaria
-
 Cambodia
-
 Cameroon
-
 Canada
-
 Chile
Chile
-
 China
China
-
 Colombia
-
 Congo
Congo
-
 Costa Rica
-
 Cote d'Ivoire
-
 Croatia
-
 Cuba
Cuba
-
 Cyprus
-
 Czechia
-
 DR Congo
-
 Denmark
-
 Dominican Republic
-
 Ecuador
-
 Egypt
Egypt
-
 El Salvador
-
 Estonia
-
 Eswatini
-
 Ethiopia
-
 Finland
-
 France
-
 Georgia
-
 Germany
-
 Ghana
Ghana
-
 Greece
-
 Haiti
Haiti
-
 Hong Kong
-
 Hungary
-
 India
India
-
 Indonesia
-
 Iran, Islamic republic
-
 Iraq
Iraq
-
 Ireland
-
 Israel
-
 Italy
Italy
-
 Jamaica
-
 Japan
Japan
-
 Jordan
-
 Kazakhstan
-
 Kenya
Kenya
-
 Korea
Korea
-
 Kuwait
-
 Kyrgyzstan
-
 Laos
Laos
-
 Latvia
-
 Lebanon
-
 Lesotho
-
 Libya
Libya
-
 Lithuania
-
 Luxembourg
-
 Madagascar
-
 Malaysia
-
 Malta
Malta
-
 Mauritius
-
 Mexico
-
 Moldova
-
 Mongolia
-
 Montenegro
-
 Morocco
-
 Mozambique
-
 Myanmar
-
 Namibia
-
 Nepal
Nepal
-
 Netherlands
-
 New Zealand
-
 Nigeria
-
 North Macedonia
-
 Norway
-
 Oman
Oman
-
 Pakistan
-
 Palestine
-
 Panama
-
 Papua New Guinea
-
 Paraguay
-
 Peru
Peru
-
 Philippines
-
 Poland
-
 Portugal
-
 Puerto Rico
-
 Qatar
Qatar
-
 Reunion
-
 Romania
-
 Rwanda
-
 Saudi Arabia
-
 Serbia
-
 Singapore
-
 Slovakia
-
 Slovenia
-
 Somalia
-
 South Africa
-
 Spain
Spain
-
 Sri Lanka
-
 Sweden
-
 Switzerland
-
 Syria
Syria
-
 Taiwan
-
 Tajikistan
-
 Tanzania
-
 Thailand
-
 Trinidad and Tobago
-
 Tunisia
-
 Turkey
-
 UAE
UAE
-
 Uganda
-
 Ukraine
-
 United Kingdom
-
United States
-
 Uruguay
-
 Uzbekistan
-
 Venezuela
-
 Vietnam
-
 Yemen
Yemen
-
 Zambia
-
 Zimbabwe
- Forex
- Crypto












