

Bitcoin technical analysis: Resistance test at $81,038 limits upside momentum

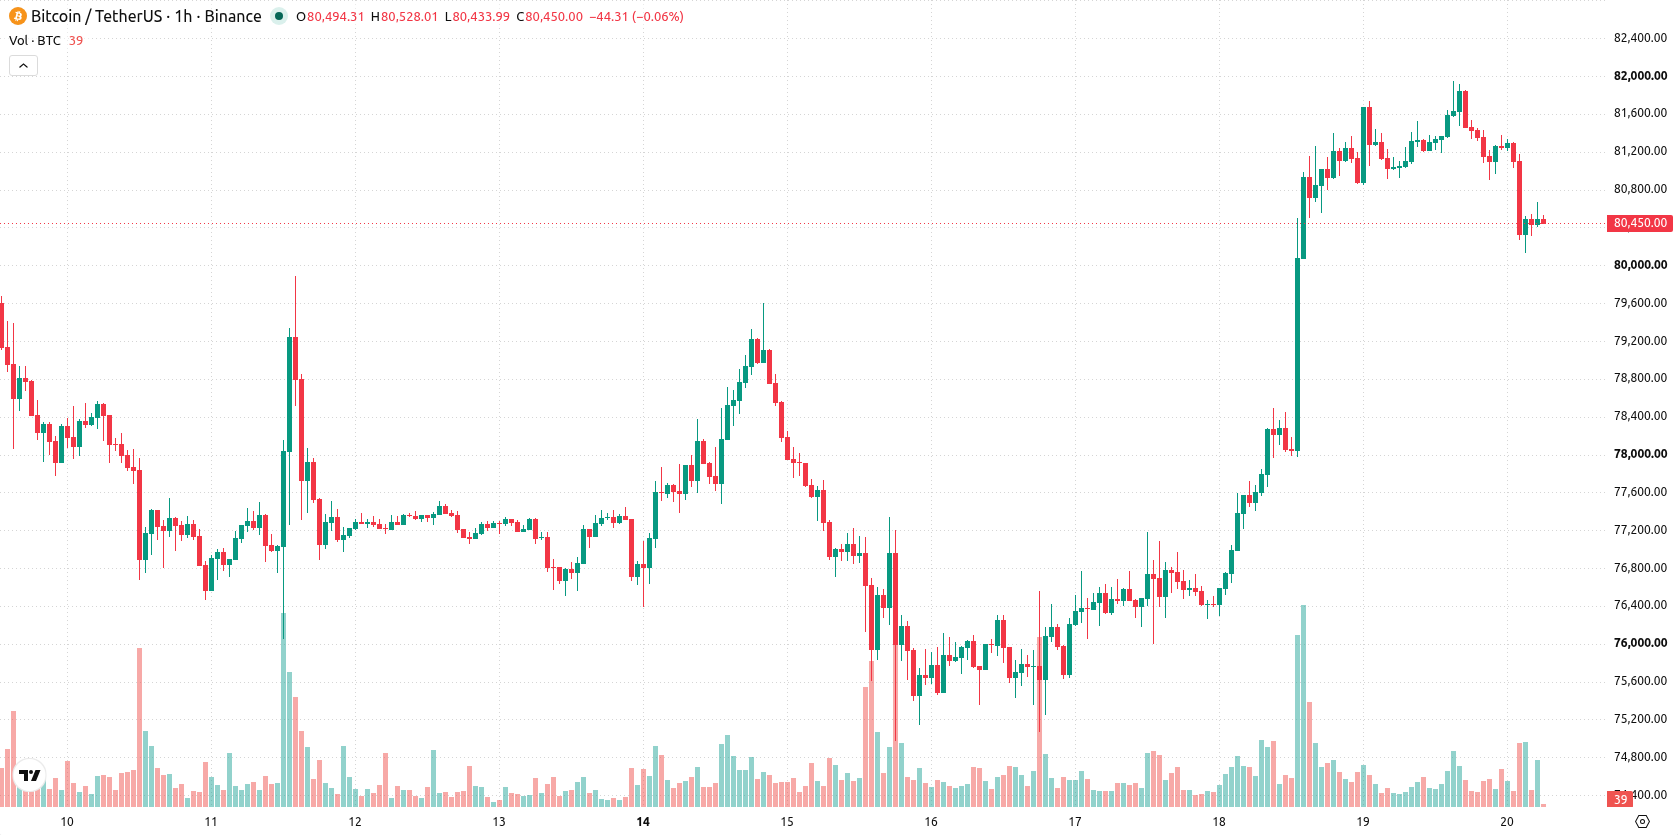
Bitcoin (BTC) is trading at $80,494 after a modest intraday pullback, drifting lower within moderate volatility. The asset currently sits below its short-term average but remains above the medium- and long-term moving averages.
 84352
86698.99
84352
86698.99
Highlights
- Bitcoin surged past $81,000 as a short squeeze forced over $243 million in short position liquidations.
- U.S. spot Bitcoin ETFs pulled in $433.03 million in net inflows, with institutional demand led by Fidelity's FBTC.
- BTC/USD is expected to trade in a range of $78,932 to $82,722 as technical signals are mixed and price remains near session lows.
Short squeeze and ETF inflows fuel mixed institutional and regulatory drivers
A significant short squeeze saw Bitcoin surge past $81,000 and forced the liquidation of over $243 million in short positions, creating mechanical buying as short sellers covered their exposures, according to Interactivecrypto. Simultaneously, U.S. spot Bitcoin ETFs attracted $433.03 million in net inflows on September 18, 2026, largely driven by contributions from Fidelity's FBTC, which increased institutional demand, as reported by Theblock. Additionally, while the U.S. Senate did not advance the CLARITY Act on September 19, 2026, both the SEC and CFTC indicated ongoing progress in crypto regulation through agency actions, according to Cryptobriefing. Together, these factors reflect mixed drivers of institutional activity, forced market covering, and a patchwork path for future policy.
Seller exhaustion builds as intraday momentum clashes with strong resistance
BTC/USD is currently positioned below its MA-20 but remains above the MA-50 and MA-200. The Ichimoku Kijun level at $81,038 serves as immediate resistance, with the price trading near the session's low. MACD shows neutral momentum, while ADX signals selling pressure. Oversold readings appear across RSI (at 39.3), Stochastic RSI, CCI, and Bull/Bear Power, suggesting seller exhaustion in the near term. Bull/Bear Power continues to indicate bearish dominance on intraday frames, and the Awesome Oscillator aligns with the prevailing downward pressure. Divergence between momentum and oscillators points to possible caution around further immediate declines.
Balanced move risk as Bitcoin faces range-bound price constraints
In the short term, BTC/USD is expected to remain confined within the $78,932 to $82,722 range as typical volatility plays out on both sides. Scenario analysis suggests an equal probability for upward or downward movement over the next 2 to 3 trading days. A sustained close above resistance at $81,038 would open the way for bullish momentum toward the upper range, while a break of near-term support could take the price toward the lower band.
Earlier, analysts noted that the widespread adoption of Bitcoin as a payment method has shifted its role from being a unique business model to a standard feature within traditional retail venues. In the context of ongoing institutional flows, regulatory developments, and technical pressures, market participants should closely monitor the $81,038 resistance level as a potential trigger for renewed bullish momentum in the short term.










-
 Afghanistan
-
 Albania
-
 Algeria
-
 Angola
-
 Argentina
-
 Armenia
-
 Australia
-
 Austria
-
 Azerbaijan
-
 Bahamas
-
 Bahrain
-
 Bangladesh
-
 Belarus
-
 Belgium
-
 Bolivia
-
 Botswana
-
 Brazil
-
 Brunei
-
 Bulgaria
-
 Cambodia
-
 Cameroon
-
 Canada
-
 Chile
Chile
-
 China
China
-
 Colombia
-
 Congo
Congo
-
 Costa Rica
-
 Cote d'Ivoire
-
 Croatia
-
 Cuba
Cuba
-
 Cyprus
-
 Czechia
-
 DR Congo
-
 Denmark
-
 Dominican Republic
-
 Ecuador
-
 Egypt
Egypt
-
 El Salvador
-
 Estonia
-
 Eswatini
-
 Ethiopia
-
 Finland
-
 France
-
 Georgia
-
 Germany
-
 Ghana
Ghana
-
 Greece
-
 Haiti
Haiti
-
 Hong Kong
-
 Hungary
-
 India
India
-
 Indonesia
-
 Iran, Islamic republic
-
 Iraq
Iraq
-
 Ireland
-
 Israel
-
 Italy
Italy
-
 Jamaica
-
 Japan
Japan
-
 Jordan
-
 Kazakhstan
-
 Kenya
Kenya
-
 Korea
Korea
-
 Kuwait
-
 Kyrgyzstan
-
 Laos
Laos
-
 Latvia
-
 Lebanon
-
 Lesotho
-
 Libya
Libya
-
 Lithuania
-
 Luxembourg
-
 Madagascar
-
 Malaysia
-
 Malta
Malta
-
 Mauritius
-
 Mexico
-
 Moldova
-
 Mongolia
-
 Montenegro
-
 Morocco
-
 Mozambique
-
 Myanmar
-
 Namibia
-
 Nepal
Nepal
-
 Netherlands
-
 New Zealand
-
 Nigeria
-
 North Macedonia
-
 Norway
-
 Oman
Oman
-
 Pakistan
-
 Palestine
-
 Panama
-
 Papua New Guinea
-
 Paraguay
-
 Peru
Peru
-
 Philippines
-
 Poland
-
 Portugal
-
 Puerto Rico
-
 Qatar
Qatar
-
 Reunion
-
 Romania
-
 Rwanda
-
 Saudi Arabia
-
 Serbia
-
 Singapore
-
 Slovakia
-
 Slovenia
-
 Somalia
-
 South Africa
-
 Spain
Spain
-
 Sri Lanka
-
 Sweden
-
 Switzerland
-
 Syria
Syria
-
 Taiwan
-
 Tajikistan
-
 Tanzania
-
 Thailand
-
 Trinidad and Tobago
-
 Tunisia
-
 Turkey
-
 UAE
UAE
-
 Uganda
-
 Ukraine
-
 United Kingdom
-
United States
-
 Uruguay
-
 Uzbekistan
-
 Venezuela
-
 Vietnam
-
 Yemen
Yemen
-
 Zambia
-
 Zimbabwe
- Forex
- Crypto












