

SEI climbs as rally pushes price toward key resistance

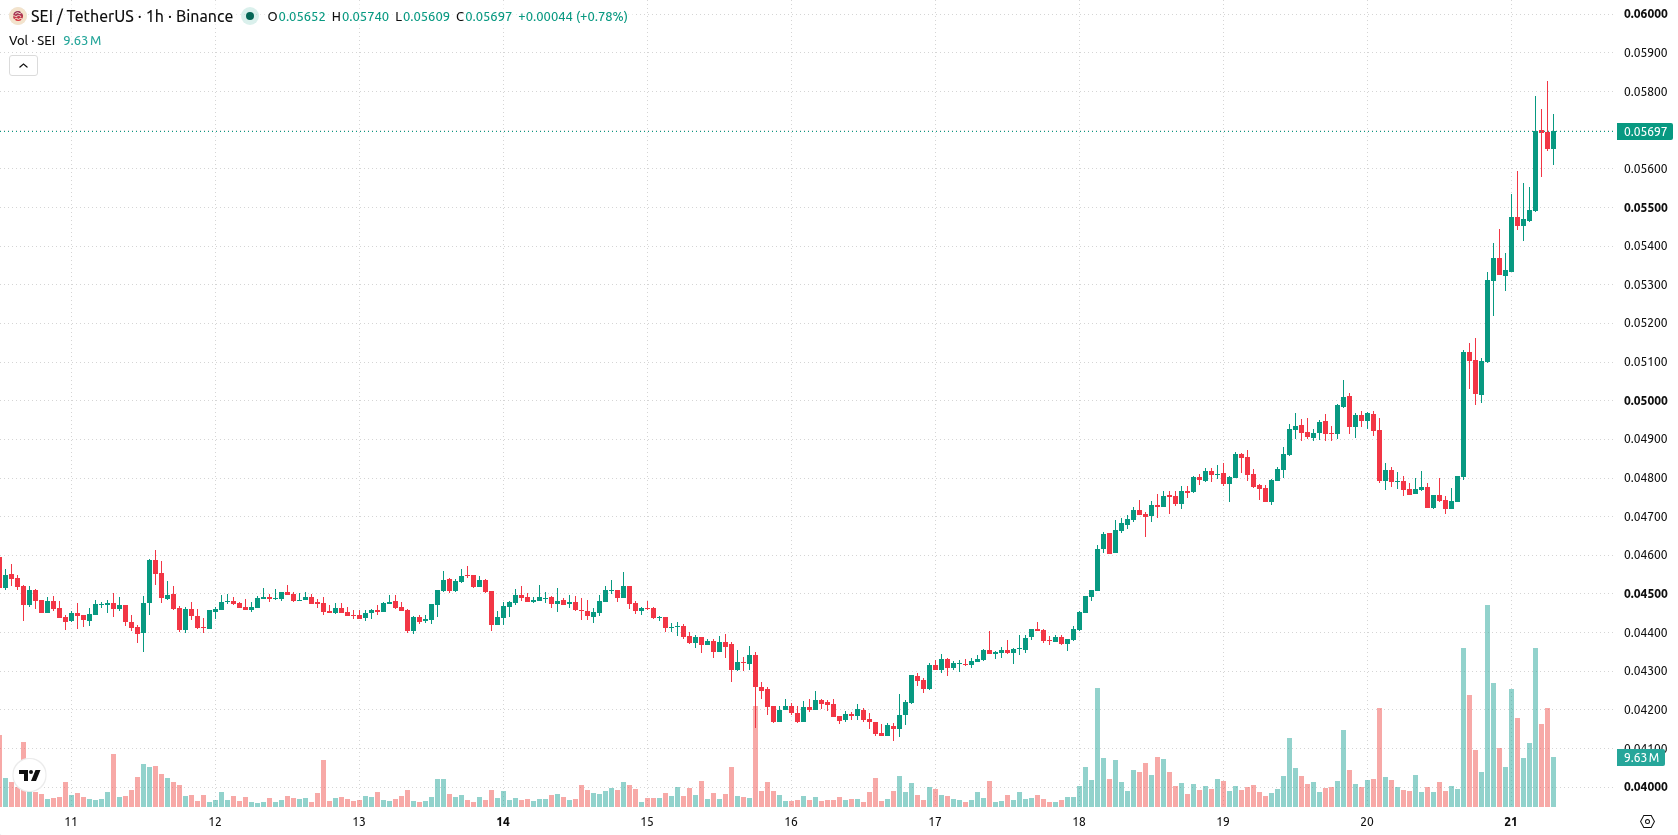
Sei (SEI) is trading at $0.0573 after rallying 20.08% over the past 24 hours. The asset continues to advance, with price holding above its key short- and medium-term moving averages, indicating the presence of strong upside momentum.
 0.0399
0.0453
Highlights
- SEI/USD trades firmly above key moving averages on hourly and daily charts, indicating dominant bullish momentum.
- Technical indicators show strong buying pressure and a 20.08% price surge to $0.0573, but overbought readings flag elevated reversal risk.
- SEI/USD is forecast to trade between $0.0543 and $0.0603 in coming days, with upside moves described as very likely.
Overbought conditions intensify as technical momentum strengthens
SEI/USD is trading above the MA-20 ($0.0522) and MA-50 ($0.0501) on the hourly chart, as well as above the daily MA-200 ($0.0534). The Ichimoku Kijun on the daily timeframe sits at $0.0525, serving as a support level. MACD and ADX readings both indicate strong bullish momentum, while RSI (81.7), Stoch RSI, and CCI are all in overbought territory, suggesting stretched buying conditions. Bull/Bear Power confirms that buyers are in control on an intraday basis, and the Awesome Oscillator supports the ongoing uptrend. Elevated volatility is present, with price moving toward session highs.
Bullish extension likely as consolidation risk remains limited
Over the next 2–3 trading days, SEI/USD is expected to trade within a projected corridor between $0.0543 and $0.0603. The probability of a continued move higher is very high, while the risk of a downside break is low. The base case scenario calls for price consolidation within this volatility band. A bullish scenario would see a clear push above $0.0603, signaling renewed buying, while a bearish outcome would trigger if price falls below support at $0.0543.
Previously it was reported that the potential launch of a Staked SEI ETF and strong technical momentum helped reinforce a bullish outlook for Sei. The current setup strengthens this view, with technical signals and volatility favoring further upside, making a decisive move above $0.0603 the next key development to watch.










-
 Afghanistan
-
 Albania
-
 Algeria
-
 Angola
-
 Argentina
-
 Armenia
-
 Australia
-
 Austria
-
 Azerbaijan
-
 Bahamas
-
 Bahrain
-
 Bangladesh
-
 Belarus
-
 Belgium
-
 Bolivia
-
 Botswana
-
 Brazil
-
 Brunei
-
 Bulgaria
-
 Cambodia
-
 Cameroon
-
 Canada
-
 Chile
-
 China
-
 Colombia
-
 Congo
-
 Costa Rica
-
 Cote d'Ivoire
-
 Croatia
-
 Cuba
-
 Cyprus
-
 Czechia
-
 DR Congo
-
 Denmark
-
 Dominican Republic
-
 Ecuador
-
 Egypt
-
 El Salvador
-
 Estonia
-
 Eswatini
-
 Ethiopia
-
 Finland
-
 France
-
 Georgia
-
 Germany
-
 Ghana
-
 Greece
-
 Haiti
-
 Hong Kong
-
 Hungary
-
 India
-
 Indonesia
-
 Iran, Islamic republic
-
 Iraq
-
 Ireland
-
 Israel
-
 Italy
-
 Jamaica
-
 Japan
-
 Jordan
-
 Kazakhstan
-
 Kenya
-
 Korea
-
 Kuwait
-
 Kyrgyzstan
-
 Laos
-
 Latvia
-
 Lebanon
-
 Lesotho
-
 Libya
-
 Lithuania
-
 Luxembourg
-
 Madagascar
-
 Malaysia
-
 Malta
-
 Mauritius
-
 Mexico
-
 Moldova
-
 Mongolia
-
 Montenegro
-
 Morocco
-
 Mozambique
-
 Myanmar
-
 Namibia
-
 Nepal
-
 Netherlands
-
 New Zealand
-
 Nigeria
-
 North Macedonia
-
 Norway
-
 Oman
-
 Pakistan
-
 Palestine
-
 Panama
-
 Papua New Guinea
-
 Paraguay
-
 Peru
-
 Philippines
-
 Poland
-
 Portugal
-
 Puerto Rico
-
 Qatar
-
 Reunion
-
 Romania
-
 Rwanda
-
 Saudi Arabia
-
 Serbia
-
 Singapore
-
 Slovakia
-
 Slovenia
-
 Somalia
-
 South Africa
-
 Spain
-
 Sri Lanka
-
 Sweden
-
 Switzerland
-
 Syria
-
 Taiwan
-
 Tajikistan
-
 Tanzania
-
 Thailand
-
 Trinidad and Tobago
-
 Tunisia
-
 Turkey
-
 UAE
-
 Uganda
-
 Ukraine
-
 United Kingdom
-
United States
-
 Uruguay
-
 Uzbekistan
-
 Venezuela
-
 Vietnam
-
 Yemen
-
 Zambia
-
 Zimbabwe
- Forex
- Crypto












