


Walrus (WAL) surged 11.28% today as bullish technical momentum and strong intraday buying pressure fueled gains in the absence of fresh news catalysts. The rally is supported in the short and medium term by trading above key moving averages, but upside is limited by an overarching bearish long-term structure.
 0.0558
0.0439
0.0558
0.0439
Highlights
- WAL/USD trades above its 20-day and 50-day moving averages, indicating short-term and medium-term bullish momentum but below the 200-day for a bearish long-term trend.
- Key indicators show mixed signals with MACD, ADX, and RSI indicating buy or bullish bias, but Stochastic RSI and CCI identify overbought conditions.
- Price is forecast to trade between $0.0307 and $0.0401 over the next five days, with a 67% chance of an upward move.
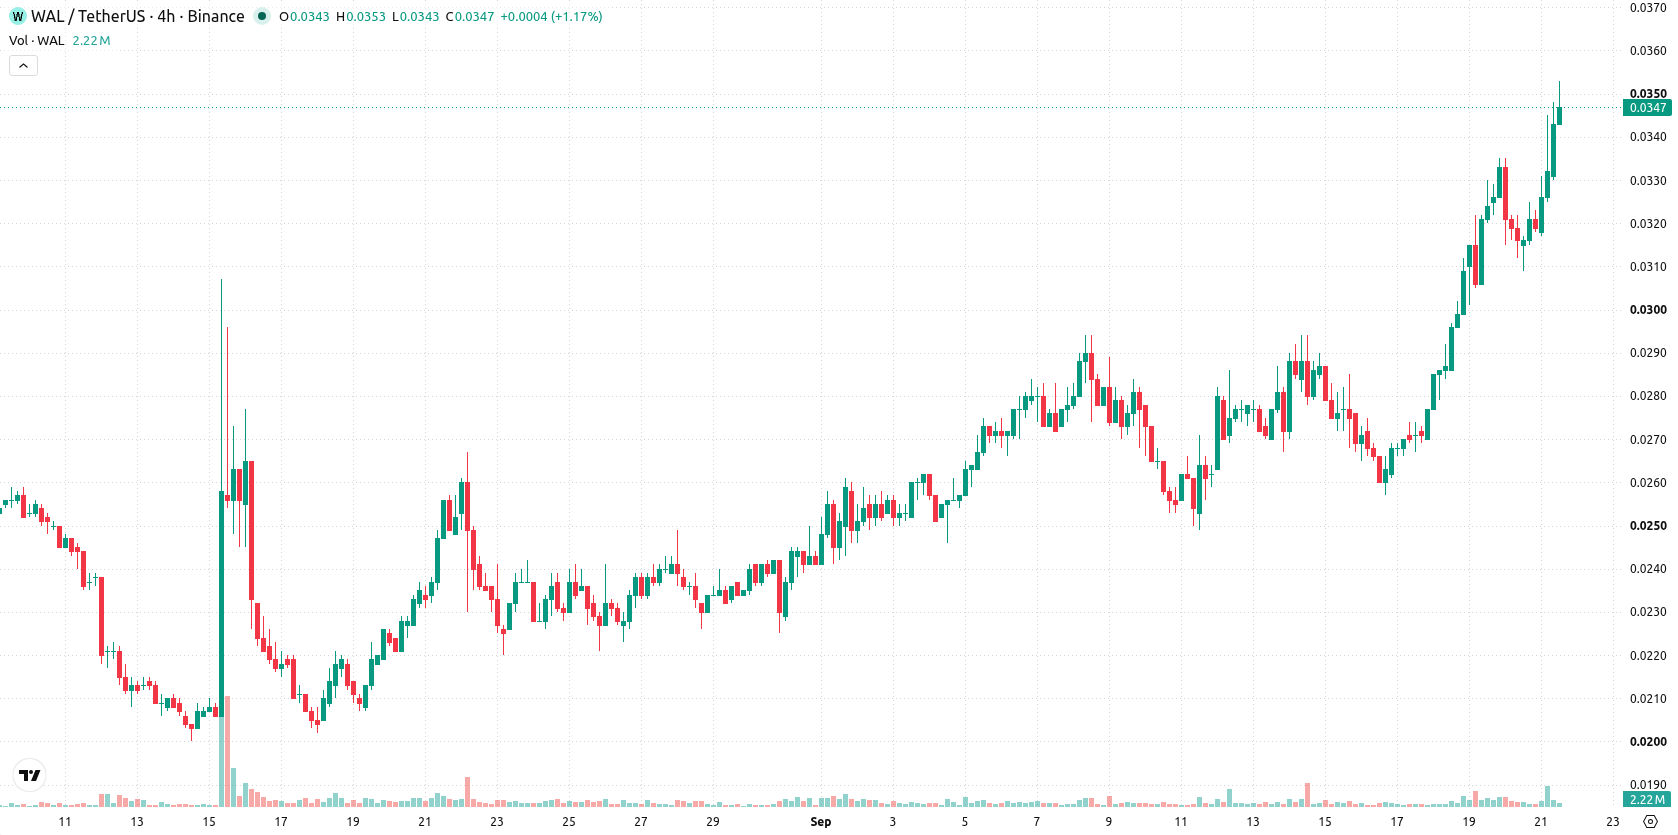
Bullish momentum holds above short-term averages amid overbought signals
WAL/USD remains above its 20-day moving average at $0.0277 and the 50-day at $0.0252, but stays below the 200-day at $0.0487, indicating short- and medium-term bullishness within a longer-term bearish trend. The Ichimoku Kijun at $0.028 serves as distant support, with near-term resistance at $0.0351 and support at $0.0335. Momentum readings are predominantly positive, with MACD and ADX signaling "Buy" and RSI climbing to 65.26, although this approaches overbought territory. The Stochastic RSI gives a "Strong Sell" signal while the CCI at 220.25 and Bull/Bear Power at 0.0046 point toward buyer dominance and overbought levels. The Awesome Oscillator stays positive, whereas the Hull Moving Average signals caution with a sell. The price action is near the session high, reflecting intraday volatility of 10.73% and persistent strength.
Earlier, analysts noted that Walrus was exhibiting short- and medium-term bullish momentum, though gains remained constrained by a persistent longer-term bearish structure. The current analysis reinforces this view, highlighting that traders should closely monitor the $0.0351 resistance level as a potential trigger for further upside or reversal within the established volatility band.










-
 Afghanistan
-
 Albania
-
 Algeria
-
 Angola
-
 Argentina
-
 Armenia
-
 Australia
-
 Austria
-
 Azerbaijan
-
 Bahamas
-
 Bahrain
-
 Bangladesh
-
 Belarus
-
 Belgium
-
 Bolivia
-
 Botswana
-
 Brazil
-
 Brunei
-
 Bulgaria
-
 Cambodia
-
 Cameroon
-
 Canada
-
 Chile
Chile
-
 China
China
-
 Colombia
-
 Congo
Congo
-
 Costa Rica
-
 Cote d'Ivoire
-
 Croatia
-
 Cuba
Cuba
-
 Cyprus
-
 Czechia
-
 DR Congo
-
 Denmark
-
 Dominican Republic
-
 Ecuador
-
 Egypt
Egypt
-
 El Salvador
-
 Estonia
-
 Eswatini
-
 Ethiopia
-
 Finland
-
 France
-
 Georgia
-
 Germany
-
 Ghana
Ghana
-
 Greece
-
 Haiti
Haiti
-
 Hong Kong
-
 Hungary
-
 India
India
-
 Indonesia
-
 Iran, Islamic republic
-
 Iraq
Iraq
-
 Ireland
-
 Israel
-
 Italy
Italy
-
 Jamaica
-
 Japan
Japan
-
 Jordan
-
 Kazakhstan
-
 Kenya
Kenya
-
 Korea
Korea
-
 Kuwait
-
 Kyrgyzstan
-
 Laos
Laos
-
 Latvia
-
 Lebanon
-
 Lesotho
-
 Libya
Libya
-
 Lithuania
-
 Luxembourg
-
 Madagascar
-
 Malaysia
-
 Malta
Malta
-
 Mauritius
-
 Mexico
-
 Moldova
-
 Mongolia
-
 Montenegro
-
 Morocco
-
 Mozambique
-
 Myanmar
-
 Namibia
-
 Nepal
Nepal
-
 Netherlands
-
 New Zealand
-
 Nigeria
-
 North Macedonia
-
 Norway
-
 Oman
Oman
-
 Pakistan
-
 Palestine
-
 Panama
-
 Papua New Guinea
-
 Paraguay
-
 Peru
Peru
-
 Philippines
-
 Poland
-
 Portugal
-
 Puerto Rico
-
 Qatar
Qatar
-
 Reunion
-
 Romania
-
 Rwanda
-
 Saudi Arabia
-
 Serbia
-
 Singapore
-
 Slovakia
-
 Slovenia
-
 Somalia
-
 South Africa
-
 Spain
Spain
-
 Sri Lanka
-
 Sweden
-
 Switzerland
-
 Syria
Syria
-
 Taiwan
-
 Tajikistan
-
 Tanzania
-
 Thailand
-
 Trinidad and Tobago
-
 Tunisia
-
 Turkey
-
 UAE
UAE
-
 Uganda
-
 Ukraine
-
 United Kingdom
-
United States
-
 Uruguay
-
 Uzbekistan
-
 Venezuela
-
 Vietnam
-
 Yemen
Yemen
-
 Zambia
-
 Zimbabwe
- Forex
- Crypto












