

Why is Maple rising today? Key levels to watch as short-term buying pressure builds

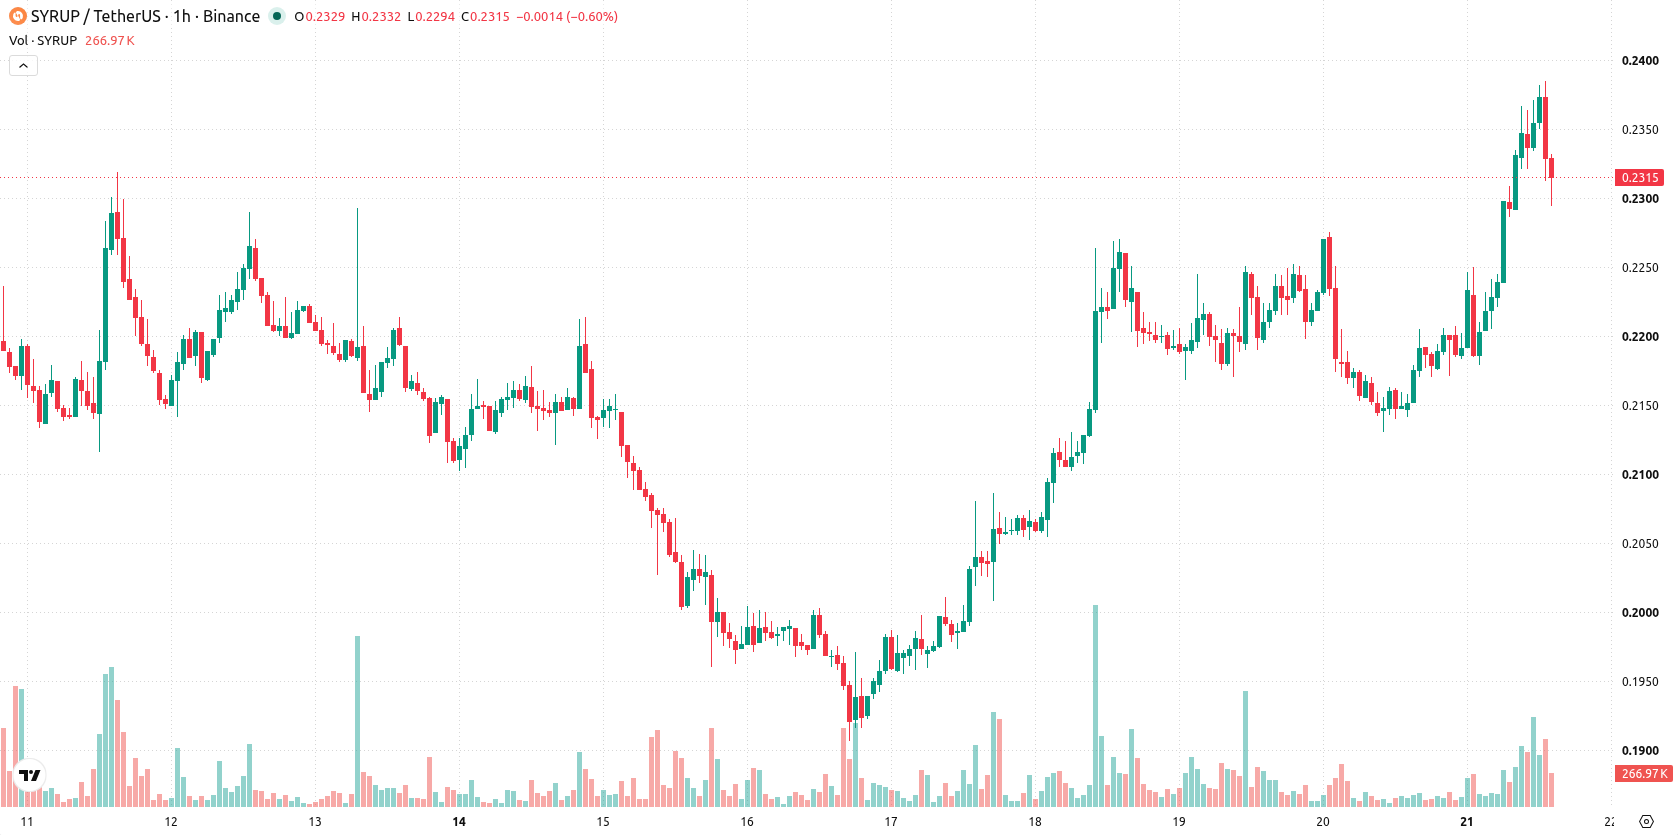
Maple (SYRUP) is trading at $0.2316, up 7.42% on the day and opening with a gap higher. The price sits above its key moving averages, reflecting current buying pressure.
 0.1029
0.1142
Highlights
- SYRUP/USD maintains strong short- and medium-term bullish momentum, with price trading well above key moving averages.
- Momentum indicators mostly support continued buying, but several oscillators indicate overbought conditions and show divergence.
- Forecasted price range for the next two to three days is $0.2188 to $0.2399, with a 74% probability of further upside.
Bullish momentum firm as multiple indicators flag overbought risk
SYRUP/USD is trading above its MA-20 of $0.2257 and MA-50 of $0.2219 on the hourly chart, while maintaining strong support above the MA-200 at $0.1946 on the daily. The Ichimoku Kijun at $0.2263 provides immediate support. On the indicator front, MACD, ADX, and Bull/Bear Power all signal ongoing momentum for buyers. RSI remains on a buy signal but is close to overbought territory, with CCI confirming overbought conditions. Stoch RSI shows a strong sell, suggesting oscillator divergence. The Awesome Oscillator is positive and backs the prevailing bullish direction.
Volatility band defined as breakout and pullback scenarios diverge
Over the next two to three trading days, SYRUP/USD is forecast to stay within the $0.2188 to $0.2399 volatility band. There is a 74% probability of further upside, with a 26% chance of a price retreat. The baseline scenario expects SYRUP to remain within its recent corridor. A bullish case would see a breakout above the upper boundary, while a bearish move could develop if the price falls below the Ichimoku Kijun support.
Earlier, analysts noted that Maple's bullish trend was supported by institutional engagement and persistent price strength. The current momentum indicators, with a high probability of further upside, suggest traders should closely monitor the potential for a breakout above the $0.2399 threshold.










-
 Afghanistan
-
 Albania
-
 Algeria
-
 Angola
-
 Argentina
-
 Armenia
-
 Australia
-
 Austria
-
 Azerbaijan
-
 Bahamas
-
 Bahrain
-
 Bangladesh
-
 Belarus
-
 Belgium
-
 Bolivia
-
 Botswana
-
 Brazil
-
 Brunei
-
 Bulgaria
-
 Cambodia
-
 Cameroon
-
 Canada
-
 Chile
-
 China
-
 Colombia
-
 Congo
-
 Costa Rica
-
 Cote d'Ivoire
-
 Croatia
-
 Cuba
-
 Cyprus
-
 Czechia
-
 DR Congo
-
 Denmark
-
 Dominican Republic
-
 Ecuador
-
 Egypt
-
 El Salvador
-
 Estonia
-
 Eswatini
-
 Ethiopia
-
 Finland
-
 France
-
 Georgia
-
 Germany
-
 Ghana
-
 Greece
-
 Haiti
-
 Hong Kong
-
 Hungary
-
 India
-
 Indonesia
-
 Iran, Islamic republic
-
 Iraq
-
 Ireland
-
 Israel
-
 Italy
-
 Jamaica
-
 Japan
-
 Jordan
-
 Kazakhstan
-
 Kenya
-
 Korea
-
 Kuwait
-
 Kyrgyzstan
-
 Laos
-
 Latvia
-
 Lebanon
-
 Lesotho
-
 Libya
-
 Lithuania
-
 Luxembourg
-
 Madagascar
-
 Malaysia
-
 Malta
-
 Mauritius
-
 Mexico
-
 Moldova
-
 Mongolia
-
 Montenegro
-
 Morocco
-
 Mozambique
-
 Myanmar
-
 Namibia
-
 Nepal
-
 Netherlands
-
 New Zealand
-
 Nigeria
-
 North Macedonia
-
 Norway
-
 Oman
-
 Pakistan
-
 Palestine
-
 Panama
-
 Papua New Guinea
-
 Paraguay
-
 Peru
-
 Philippines
-
 Poland
-
 Portugal
-
 Puerto Rico
-
 Qatar
-
 Reunion
-
 Romania
-
 Rwanda
-
 Saudi Arabia
-
 Serbia
-
 Singapore
-
 Slovakia
-
 Slovenia
-
 Somalia
-
 South Africa
-
 Spain
-
 Sri Lanka
-
 Sweden
-
 Switzerland
-
 Syria
-
 Taiwan
-
 Tajikistan
-
 Tanzania
-
 Thailand
-
 Trinidad and Tobago
-
 Tunisia
-
 Turkey
-
 UAE
-
 Uganda
-
 Ukraine
-
 United Kingdom
-
United States
-
 Uruguay
-
 Uzbekistan
-
 Venezuela
-
 Vietnam
-
 Yemen
-
 Zambia
-
 Zimbabwe
- Forex
- Crypto












