

U.S. spot Bitcoin ETFs $999M daily inflow lifts Bitcoin price toward $89,045 resistance

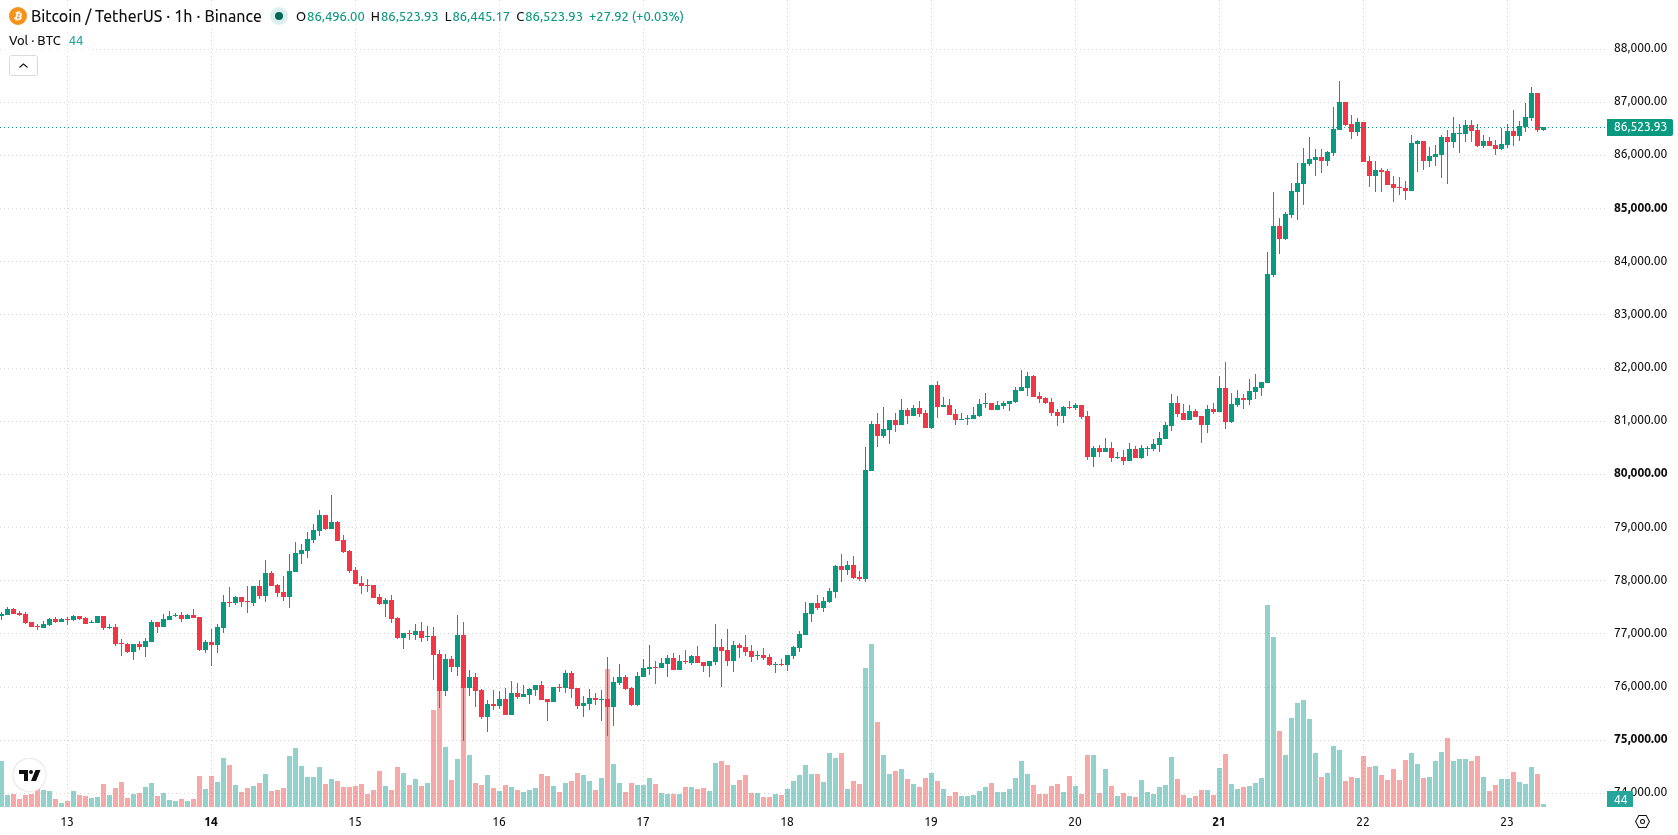
Bitcoin (BTC) is trading at $86,497, marking a 1.21% gain on the day. The asset sits above its key moving averages, reflecting ongoing bullish momentum amid moderate volatility.
 78878.01
81971.00
Highlights
- U.S. spot Bitcoin ETFs recorded $999 million in net inflows, marking the largest daily institutional inflow in 11 months.
- Over $920 million in short liquidations drove rapid covering of bearish positions, supporting strong upward price movement for Bitcoin.
- BTC/USD trades in a broadly bullish structure, with technical momentum strong and the range expected at $83,949 to $89,045 in the next 2 to 3 days.
Institutional demand surges as ETFs see record inflows and shorts liquidate
U.S. spot Bitcoin ETFs witnessed $999 million in net inflows, the largest daily institutional inflow in 11 months, according to SoSoValue. This influx has boosted institutional demand for Bitcoin, increasing liquidity through regulated channels and driving fresh buying in the asset. Additional support came from short liquidations totaling over $920 million, which caused rapid covering of bearish positions and accelerated upward price momentum, Coinedition reported. Broader market enthusiasm is further reflected in the total Crypto market capitalization exceeding $3 trillion, reinforcing the current trend.
Bullish momentum persists as overbought readings signal exhaustion risk
BTC/USD has cleared the MA-20 at $86,328 and the MA-50 at $85,527 on the hourly chart, while the daily Ichimoku Kijun at $86,044 serves as an immediate support zone. The next major support stands at the MA-200 on the daily timeframe near $70,709, while immediate resistance approaches the upper bound of the current range at $89,045. Technical indicators show MACD and ADX both signaling strong bullish momentum, with RSI at 67.77 in buy territory. However, Stoch RSI, CCI, and Bull/Bear Power readings remain elevated in overbought territory, and the Awesome Oscillator continues to confirm the underlying bullish setup. This mix of momentum and overbought signals suggests robust demand but introduces the risk of short-term exhaustion if buying slows.
Consolidation likely as price nears resistance and upside breakout looms
In the short term, BTC/USD is expected to consolidate within a typical volatility band between $83,949 and $89,045 over the next two to three sessions. The baseline scenario anticipates further movement inside this range, with a high probability of additional upside if resistance is cleanly breached. A bullish breakout above $89,045 would likely trigger trend continuation, while a decisive drop below immediate support at the Ichimoku Kijun could open the door to a pullback toward lower levels.
Previously it was reported that Bitcoin and the broader cryptocurrency market rallied sharply, with rising ETF inflows and increased derivatives activity driving significant gains across major digital assets. The latest data reinforce this bullish backdrop but highlight a heightened risk of short-term exhaustion, making price reaction at the $89,045 resistance level an important signal for traders monitoring potential breakout or reversal scenarios.






Latest Bitcoin News





-
 Afghanistan
-
 Albania
-
 Algeria
-
 Angola
-
 Argentina
-
 Armenia
-
 Australia
-
 Austria
-
 Azerbaijan
-
 Bahamas
-
 Bahrain
-
 Bangladesh
-
 Belarus
-
 Belgium
-
 Bolivia
-
 Botswana
-
 Brazil
-
 Brunei
-
 Bulgaria
-
 Cambodia
-
 Cameroon
-
 Canada
-
 Chile
-
 China
-
 Colombia
-
 Congo
-
 Costa Rica
-
 Cote d'Ivoire
-
 Croatia
-
 Cuba
-
 Cyprus
-
 Czechia
-
 DR Congo
-
 Denmark
-
 Dominican Republic
-
 Ecuador
-
 Egypt
-
 El Salvador
-
 Estonia
-
 Eswatini
-
 Ethiopia
-
 Finland
-
 France
-
 Georgia
-
 Germany
-
 Ghana
-
 Greece
-
 Haiti
-
 Hong Kong
-
 Hungary
-
 India
-
 Indonesia
-
 Iran, Islamic republic
-
 Iraq
-
 Ireland
-
 Israel
-
 Italy
-
 Jamaica
-
 Japan
-
 Jordan
-
 Kazakhstan
-
 Kenya
-
 Korea
-
 Kuwait
-
 Kyrgyzstan
-
 Laos
-
 Latvia
-
 Lebanon
-
 Lesotho
-
 Libya
-
 Lithuania
-
 Luxembourg
-
 Madagascar
-
 Malaysia
-
 Malta
-
 Mauritius
-
 Mexico
-
 Moldova
-
 Mongolia
-
 Montenegro
-
 Morocco
-
 Mozambique
-
 Myanmar
-
 Namibia
-
 Nepal
-
 Netherlands
-
 New Zealand
-
 Nigeria
-
 North Macedonia
-
 Norway
-
 Oman
-
 Pakistan
-
 Palestine
-
 Panama
-
 Papua New Guinea
-
 Paraguay
-
 Peru
-
 Philippines
-
 Poland
-
 Portugal
-
 Puerto Rico
-
 Qatar
-
 Reunion
-
 Romania
-
 Rwanda
-
 Saudi Arabia
-
 Serbia
-
 Singapore
-
 Slovakia
-
 Slovenia
-
 Somalia
-
 South Africa
-
 Spain
-
 Sri Lanka
-
 Sweden
-
 Switzerland
-
 Syria
-
 Taiwan
-
 Tajikistan
-
 Tanzania
-
 Thailand
-
 Trinidad and Tobago
-
 Tunisia
-
 Turkey
-
 UAE
-
 Uganda
-
 Ukraine
-
 United Kingdom
-
United States
-
 Uruguay
-
 Uzbekistan
-
 Venezuela
-
 Vietnam
-
 Yemen
-
 Zambia
-
 Zimbabwe
- Forex
- Crypto












