

Can Stellar hold support as oversold conditions hint at possible rebound?

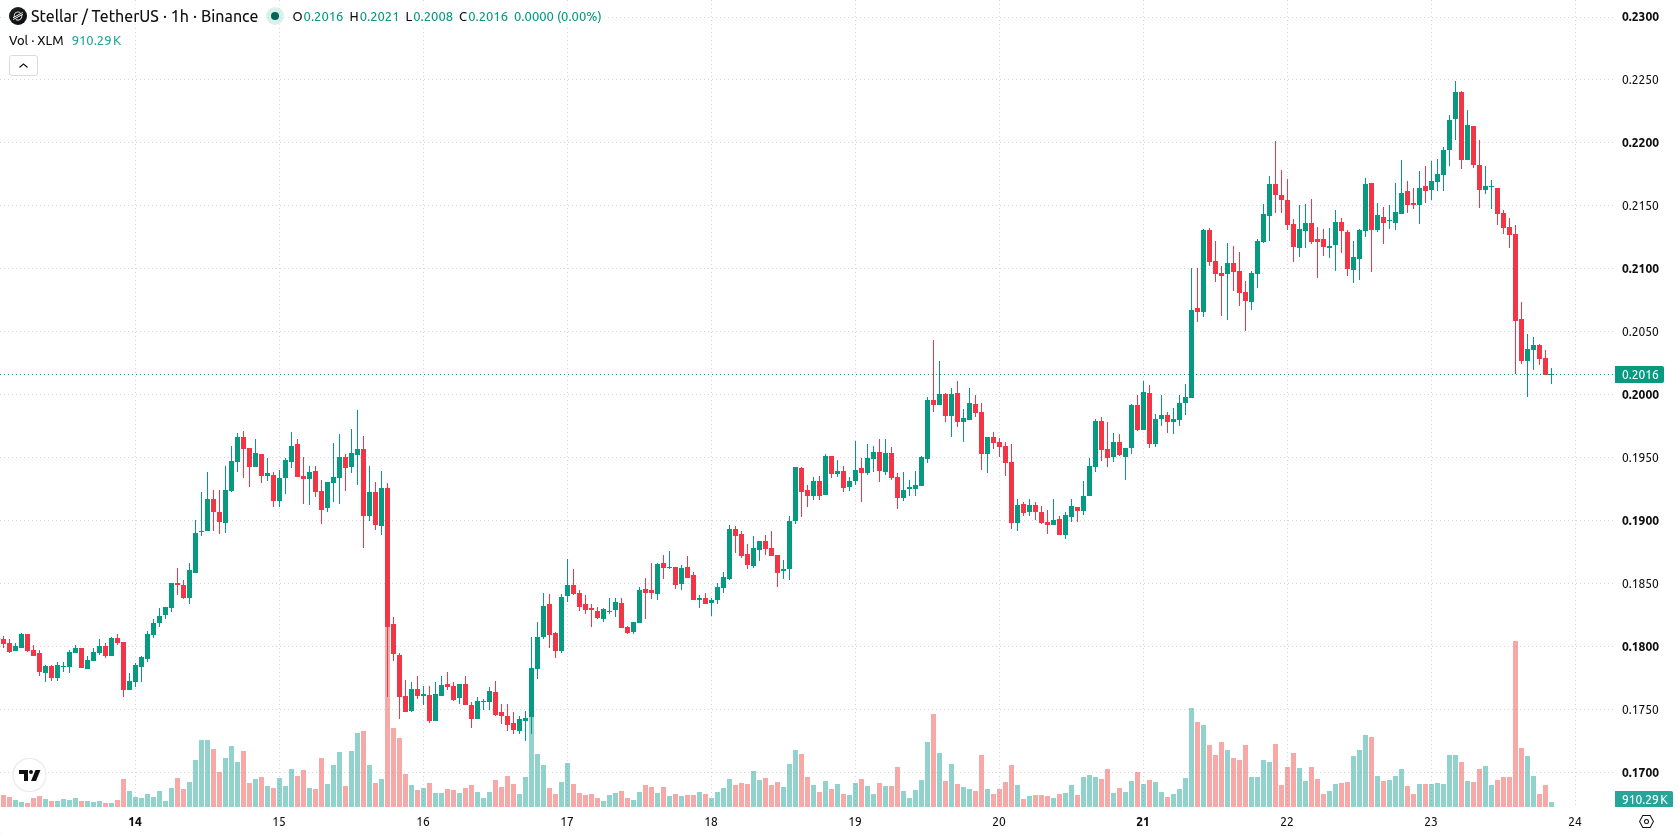
Stellar (XLM) is trading at $0.2011 after falling 7.03% over the last 24 hours. The cryptocurrency remains below its short- and medium-term moving averages but is holding above longer-term trend supports.
 0.167
0.1752
Highlights
- BVNK has added Stellar blockchain support to its stablecoin payments platform, enabling unified API access across over 130 markets.
- The update reduces cross-border payment costs and settlement times for institutional clients, potentially increasing Stellar’s global transaction utility.
- XLM trades under key moving averages with strong seller dominance and oversold indicators, projected to consolidate in the $0.1923 to $0.2112 range.
Stellar blockchain upgrade spurs institutional flows despite persistent selling
BVNK has integrated the Stellar blockchain into its stablecoin payments platform, allowing businesses to conduct payments, remittances, and treasury transfers across more than 130 markets via a unified API. This infrastructure upgrade streamlines cross-border transactions for institutional clients by lowering costs and settlement times, potentially expanding Stellar’s use in global payment flows. Despite these operational gains supporting the utility of the network, price action has remained under broader selling pressure.
Technical signals deteriorate as momentum indicators flash sustained weakness
On the technical front, XLM/USD is trading below the MA-20 at $0.2134 and MA-50 at $0.2136 on the h1 timeframe, while it sits above the MA-200 at $0.1773, creating a zone where longer-term support may emerge. Immediate resistance is defined by the Ichimoku Kijun at $0.2124. Momentum readings remain distinctly negative: MACD and ADX register active Sell signals, and the RSI is deep in oversold territory at 28.707. Both Stoch RSI and CCI also confirm oversold conditions, with Bull/Bear Power highlighting intraday seller dominance, and the Awesome Oscillator trending in line with the prevailing downtrend.
Price corridor expected as post-drop volatility shapes near-term outlook
For the next two to three trading days, XLM is expected to consolidate in a range between $0.1923 and $0.2112, reflecting typical volatility following the recent steep decline. The baseline scenario envisions continued movement within this corridor. Should XLM break and sustain above the immediate resistance at $0.2124, a recovery could unfold toward higher levels. Conversely, if the price falls below $0.1923, further declines are likely as downside momentum persists.
Earlier, analysts noted that the rollout of Protocol 28 and associated upgrades positioned Stellar for increased adoption and technical momentum. With XLM now under sustained downside pressure but new infrastructure integrations enhancing network utility, traders should monitor whether consolidation above the $0.1923 support stabilizes sentiment or if further weakness intensifies short-term risks.











-
 Afghanistan
-
 Albania
-
 Algeria
-
 Angola
-
 Argentina
-
 Armenia
-
 Australia
-
 Austria
-
 Azerbaijan
-
 Bahamas
-
 Bahrain
-
 Bangladesh
-
 Belarus
-
 Belgium
-
 Bolivia
-
 Botswana
-
 Brazil
-
 Brunei
-
 Bulgaria
-
 Cambodia
-
 Cameroon
-
 Canada
-
 Chile
-
 China
-
 Colombia
-
 Congo
-
 Costa Rica
-
 Cote d'Ivoire
-
 Croatia
-
 Cuba
-
 Cyprus
-
 Czechia
-
 DR Congo
-
 Denmark
-
 Dominican Republic
-
 Ecuador
-
 Egypt
-
 El Salvador
-
 Estonia
-
 Eswatini
-
 Ethiopia
-
 Finland
-
 France
-
 Georgia
-
 Germany
-
 Ghana
-
 Greece
-
 Haiti
-
 Hong Kong
-
 Hungary
-
 India
-
 Indonesia
-
 Iran, Islamic republic
-
 Iraq
-
 Ireland
-
 Israel
-
 Italy
-
 Jamaica
-
 Japan
-
 Jordan
-
 Kazakhstan
-
 Kenya
-
 Korea
-
 Kuwait
-
 Kyrgyzstan
-
 Laos
-
 Latvia
-
 Lebanon
-
 Lesotho
-
 Libya
-
 Lithuania
-
 Luxembourg
-
 Madagascar
-
 Malaysia
-
 Malta
-
 Mauritius
-
 Mexico
-
 Moldova
-
 Mongolia
-
 Montenegro
-
 Morocco
-
 Mozambique
-
 Myanmar
-
 Namibia
-
 Nepal
-
 Netherlands
-
 New Zealand
-
 Nigeria
-
 North Macedonia
-
 Norway
-
 Oman
-
 Pakistan
-
 Palestine
-
 Panama
-
 Papua New Guinea
-
 Paraguay
-
 Peru
-
 Philippines
-
 Poland
-
 Portugal
-
 Puerto Rico
-
 Qatar
-
 Reunion
-
 Romania
-
 Rwanda
-
 Saudi Arabia
-
 Serbia
-
 Singapore
-
 Slovakia
-
 Slovenia
-
 Somalia
-
 South Africa
-
 Spain
-
 Sri Lanka
-
 Sweden
-
 Switzerland
-
 Syria
-
 Taiwan
-
 Tajikistan
-
 Tanzania
-
 Thailand
-
 Trinidad and Tobago
-
 Tunisia
-
 Turkey
-
 UAE
-
 Uganda
-
 Ukraine
-
 United Kingdom
-
United States
-
 Uruguay
-
 Uzbekistan
-
 Venezuela
-
 Vietnam
-
 Yemen
-
 Zambia
-
 Zimbabwe
- Forex
- Crypto












