

Bitcoin price prediction: $83,760 support in focus? BTC drops 2.74%

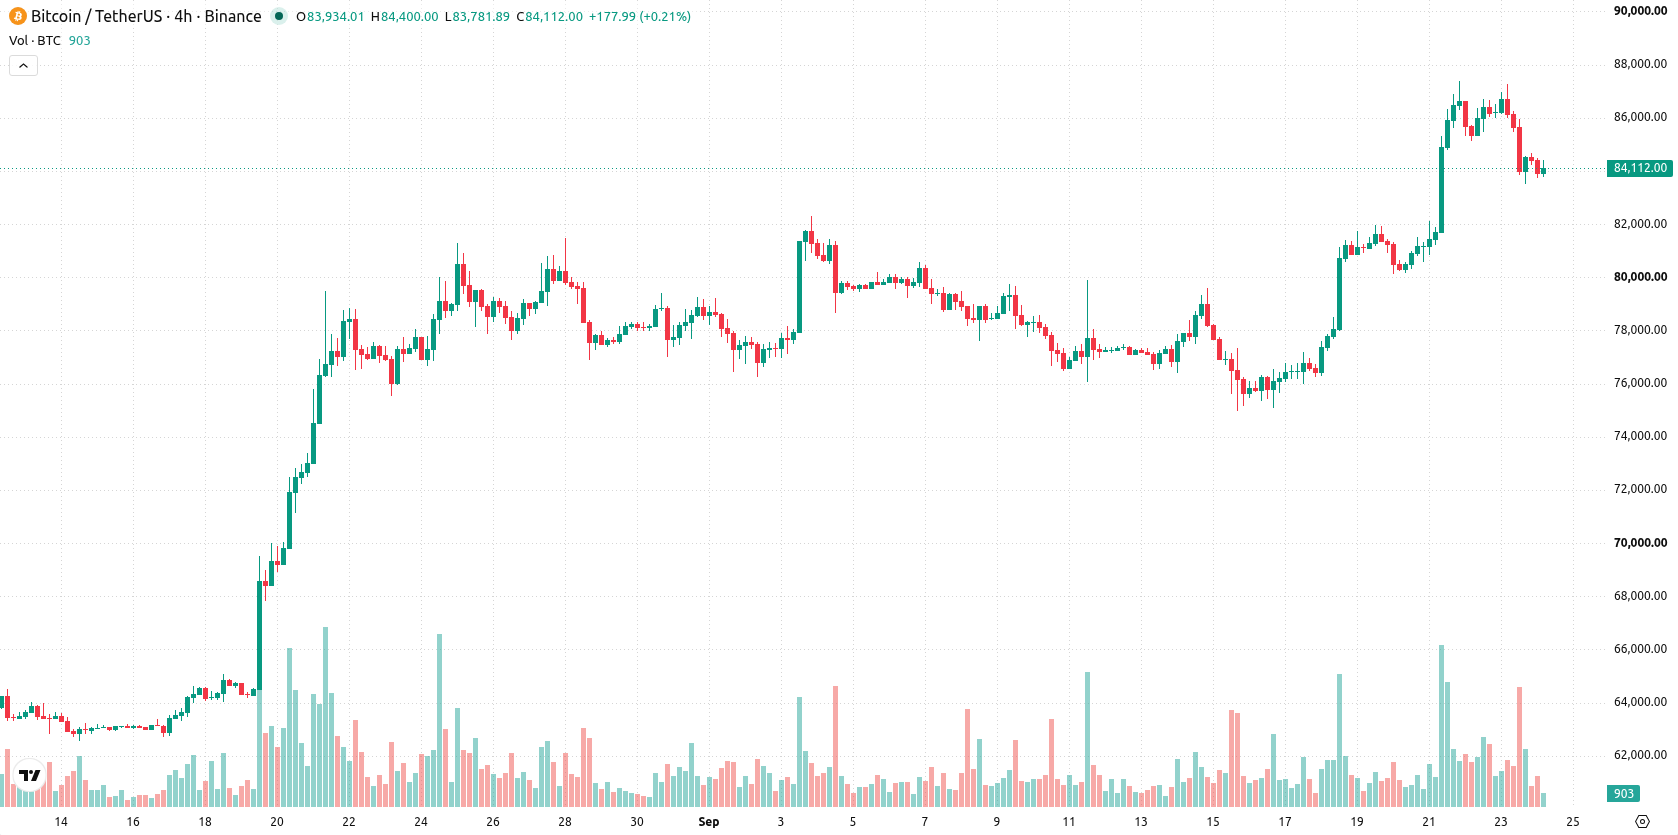
Bitcoin (BTC) is trading at $84,153, registering a daily loss of 2.74%. The asset has fallen below its short-term trend markers but remains supported by underlying medium- to long-term averages.
 78878.01
81971.00
Highlights
- US Treasury yields surged above 5% after a stronger US business activity report, tightening financial conditions.
- Higher yields have reduced risk appetite and contributed to a drop in Bitcoin's market performance.
- Bitcoin trades below short-term trendlines but above longer-term support, with a projected range of $79,189 to $94,429 over several days.
US yields surge as business activity dents crypto risk appetite
A stronger-than-expected US business activity report led to a notable increase in US Treasury yields, which surged above 5% according to Benzinga. The resulting jump in yields signals tighter financial conditions, often curbing investor risk appetite and prompting a rotation out of speculative assets like Bitcoin. This macroeconomic dynamic has contributed to downward pressure on Bitcoin's market performance.
Momentum signals diverge as mixed technical support persists
On the H4 timeframe, BTC is positioned below the MA-20 but remains above the MA-50 and firmly over the MA-200. The Ichimoku Kijun sits at $83,760, providing immediate support. Momentum indicators show a mixed picture: MACD is in Strong Buy territory, ADX signals Buy, and RSI is positive at 53.42. CCI remains Neutral, while Stochastic RSI stands in Oversold. Bull/Bear Power suggests sellers dominate the short-term, and the Awesome Oscillator is Neutral, offering no clear bias. Notably, there is divergence between strong momentum readings and the more cautious signals from oscillators, indicating conflicted intraday sentiment.
Sideways trading favored as volatility band narrows risk
Looking ahead to the coming days, BTC is expected to trade within a corridor of $79,189 to $94,429, a volatility band relative to current levels. The base case scenario sees the price consolidating sideways within this range. There is a 68% probability for an upward move, making further downside less likely. A bullish breakout would require a move above resistance, while a bearish scenario could develop if support at $83,760 is breached.
Earlier, analysts noted that Bitcoin was under sustained downside risk as selling pressures outweighed positive ETF inflows and technical momentum remained negative. The current technical setup introduces mixed momentum and oscillators while heightened macroeconomic headwinds add a new dimension, making the $83,760 support level a critical threshold to monitor for a potential shift in price direction.











-
 Afghanistan
-
 Albania
-
 Algeria
-
 Angola
-
 Argentina
-
 Armenia
-
 Australia
-
 Austria
-
 Azerbaijan
-
 Bahamas
-
 Bahrain
-
 Bangladesh
-
 Belarus
-
 Belgium
-
 Bolivia
-
 Botswana
-
 Brazil
-
 Brunei
-
 Bulgaria
-
 Cambodia
-
 Cameroon
-
 Canada
-
 Chile
-
 China
-
 Colombia
-
 Congo
-
 Costa Rica
-
 Cote d'Ivoire
-
 Croatia
-
 Cuba
-
 Cyprus
-
 Czechia
-
 DR Congo
-
 Denmark
-
 Dominican Republic
-
 Ecuador
-
 Egypt
-
 El Salvador
-
 Estonia
-
 Eswatini
-
 Ethiopia
-
 Finland
-
 France
-
 Georgia
-
 Germany
-
 Ghana
-
 Greece
-
 Haiti
-
 Hong Kong
-
 Hungary
-
 India
-
 Indonesia
-
 Iran, Islamic republic
-
 Iraq
-
 Ireland
-
 Israel
-
 Italy
-
 Jamaica
-
 Japan
-
 Jordan
-
 Kazakhstan
-
 Kenya
-
 Korea
-
 Kuwait
-
 Kyrgyzstan
-
 Laos
-
 Latvia
-
 Lebanon
-
 Lesotho
-
 Libya
-
 Lithuania
-
 Luxembourg
-
 Madagascar
-
 Malaysia
-
 Malta
-
 Mauritius
-
 Mexico
-
 Moldova
-
 Mongolia
-
 Montenegro
-
 Morocco
-
 Mozambique
-
 Myanmar
-
 Namibia
-
 Nepal
-
 Netherlands
-
 New Zealand
-
 Nigeria
-
 North Macedonia
-
 Norway
-
 Oman
-
 Pakistan
-
 Palestine
-
 Panama
-
 Papua New Guinea
-
 Paraguay
-
 Peru
-
 Philippines
-
 Poland
-
 Portugal
-
 Puerto Rico
-
 Qatar
-
 Reunion
-
 Romania
-
 Rwanda
-
 Saudi Arabia
-
 Serbia
-
 Singapore
-
 Slovakia
-
 Slovenia
-
 Somalia
-
 South Africa
-
 Spain
-
 Sri Lanka
-
 Sweden
-
 Switzerland
-
 Syria
-
 Taiwan
-
 Tajikistan
-
 Tanzania
-
 Thailand
-
 Trinidad and Tobago
-
 Tunisia
-
 Turkey
-
 UAE
-
 Uganda
-
 Ukraine
-
 United Kingdom
-
United States
-
 Uruguay
-
 Uzbekistan
-
 Venezuela
-
 Vietnam
-
 Yemen
-
 Zambia
-
 Zimbabwe
- Forex
- Crypto












