

Sei faces support test at $0.0535: Can SEI avoid deeper losses?

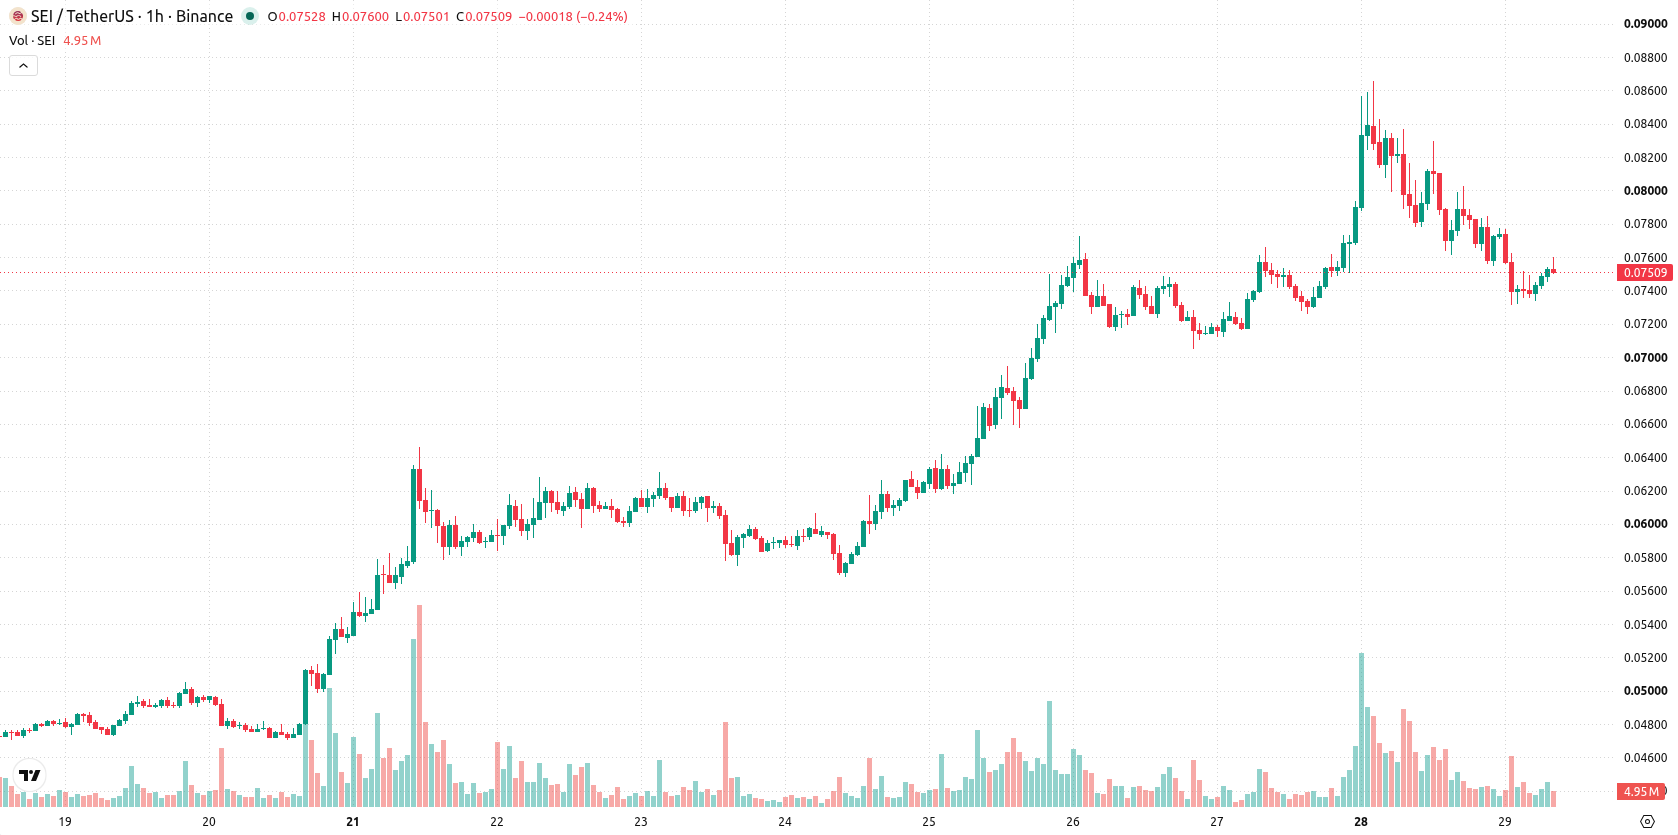
Sei (SEI) is trading at $0.0751, down 7.3% for the day. The asset currently sits below its key short- and medium-term moving averages while holding above longer-term trend levels.
 0.0492
0.0545
Highlights
- SEI has rebounded over 100% from its August 2026 low of $0.03824, signaling a substantial recovery in asset value.
- Market attention has focused on the potential for a Staked SEI ETF filing, which has raised expectations for future token demand.
- SEI trades below key short- and medium-term moving averages with bearish momentum signals, and is likely to range between $0.0684 and $0.0818 in the next two to three days.
Rebound from all-time lows faces resistance as ETF rumors stoke anticipation
SEI has staged a notable rebound of over 100% from its August 2026 all-time low of $0.03824, marking a historical recovery in underlying asset sentiment. The token is currently encountering technical resistance at a falling wedge formation, which may constrain immediate upward movement. According to Coinpedia and Kucoin, recent market attention has also centered on the possibility of a Staked SEI ETF filing, a development that has heightened anticipation regarding future demand, though price action has remained under broader selling pressure.
Technical barriers persist as sellers dominate momentum indicators
On the hourly chart, SEI is trading below its MA-20 at $0.0766 and MA-50 at $0.0772, while on the daily timeframe, the price remains above its MA-200 at $0.0535. The Ichimoku Kijun sits at $0.0784, serving as immediate resistance. Momentum indicators are skewed toward sellers, with RSI at 44.286 and MACD showing ongoing selling pressure, while ADX is neutral and Stoch RSI remains flat. CCI and Bull/Bear Power reinforce seller dominance, while the Awesome Oscillator is neutral, confirming mixed but overall weak momentum.
Range-bound outlook prevails as downside risk outweighs reversal potential
Over the next two to three trading days, SEI is expected to move within a range from $0.0684 to $0.0818. There is a 53% probability of further downside from current levels, with a less likely 47% chance of an upward move. The base case anticipates sideways trading within this volatility band, with a bullish breakout contingent on persistent buying above immediate resistance, and a bearish scenario likely if selling intensifies below support.
Earlier, analysts noted that Sei was exhibiting strong bullish momentum supported by infrastructure developments and sector recognition. With current weakness in momentum indicators and technical resistance evident, traders should remain alert for a decisive move outside the $0.0684 to $0.0818 trading range in the coming sessions.









-
 Afghanistan
-
 Albania
-
 Algeria
-
 Angola
-
 Argentina
-
 Armenia
-
 Australia
-
 Austria
-
 Azerbaijan
-
 Bahamas
-
 Bahrain
-
 Bangladesh
-
 Belarus
-
 Belgium
-
 Bolivia
-
 Botswana
-
 Brazil
-
 Brunei
-
 Bulgaria
-
 Cambodia
-
 Cameroon
-
 Canada
-
 Chile
-
 China
-
 Colombia
-
 Congo
-
 Costa Rica
-
 Cote d'Ivoire
-
 Croatia
-
 Cuba
-
 Cyprus
-
 Czechia
-
 DR Congo
-
 Denmark
-
 Dominican Republic
-
 Ecuador
-
 Egypt
-
 El Salvador
-
 Estonia
-
 Eswatini
-
 Ethiopia
-
 Finland
-
 France
-
 Georgia
-
 Germany
-
 Ghana
-
 Greece
-
 Haiti
-
 Hong Kong
-
 Hungary
-
 India
-
 Indonesia
-
 Iran, Islamic republic
-
 Iraq
-
 Ireland
-
 Israel
-
 Italy
-
 Jamaica
-
 Japan
-
 Jordan
-
 Kazakhstan
-
 Kenya
-
 Korea
-
 Kuwait
-
 Kyrgyzstan
-
 Laos
-
 Latvia
-
 Lebanon
-
 Lesotho
-
 Libya
-
 Lithuania
-
 Luxembourg
-
 Madagascar
-
 Malaysia
-
 Malta
-
 Mauritius
-
 Mexico
-
 Moldova
-
 Mongolia
-
 Montenegro
-
 Morocco
-
 Mozambique
-
 Myanmar
-
 Namibia
-
 Nepal
-
 Netherlands
-
 New Zealand
-
 Nigeria
-
 North Macedonia
-
 Norway
-
 Oman
-
 Pakistan
-
 Palestine
-
 Panama
-
 Papua New Guinea
-
 Paraguay
-
 Peru
-
 Philippines
-
 Poland
-
 Portugal
-
 Puerto Rico
-
 Qatar
-
 Reunion
-
 Romania
-
 Rwanda
-
 Saudi Arabia
-
 Serbia
-
 Singapore
-
 Slovakia
-
 Slovenia
-
 Somalia
-
 South Africa
-
 Spain
-
 Sri Lanka
-
 Sweden
-
 Switzerland
-
 Syria
-
 Taiwan
-
 Tajikistan
-
 Tanzania
-
 Thailand
-
 Trinidad and Tobago
-
 Tunisia
-
 Turkey
-
 UAE
-
 Uganda
-
 Ukraine
-
 United Kingdom
-
United States
-
 Uruguay
-
 Uzbekistan
-
 Venezuela
-
 Vietnam
-
 Yemen
-
 Zambia
-
 Zimbabwe
- Forex
- Crypto












