

Jupiter support pressure: Downside targets to watch

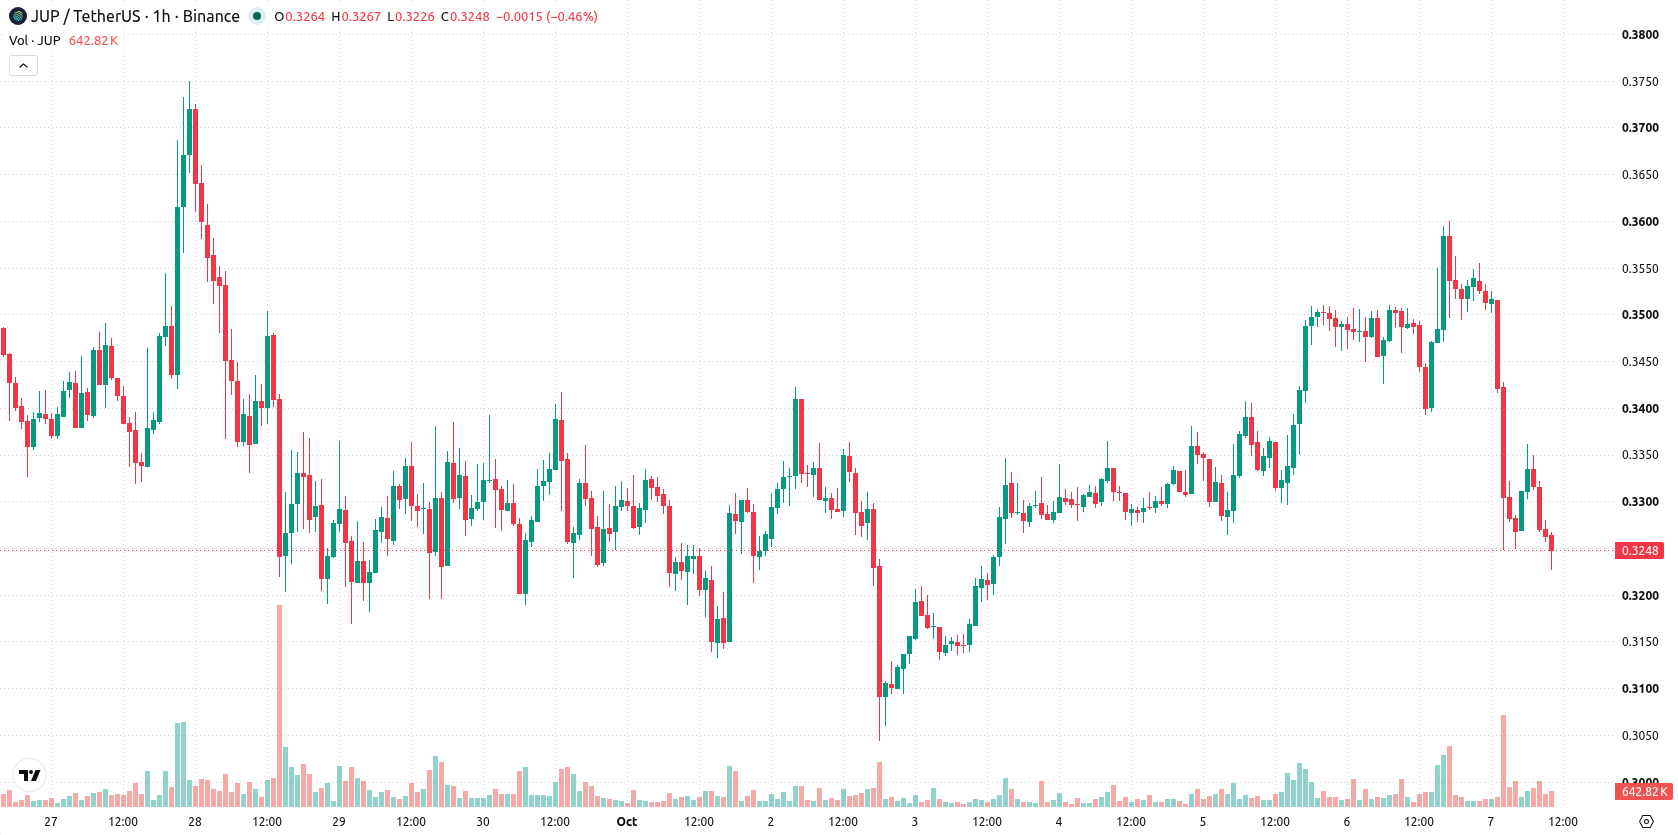
Jupiter (JUP) is trading at $0.3262 after declining 6.88% in the latest session. The token is positioned below its key short- and medium-term moving averages but remains supported on longer-term charts.
 0.2519
0.2732
Highlights
- Jupiter reports a market capitalization of $1.16 billion, suggesting possible institutional interest in the asset.
- Daily trading volume is 6.92% below the monthly average, indicating decreased activity and increased short-term volatility risk.
- JUP trades below key short- and medium-term moving averages with strong bearish momentum, expected to consolidate in the $0.3137 to $0.3387 range over the next two to three days.
Lower trading activity as institutional interest meets declining volume
Jupiter recently reported a market capitalization of $1.16 billion, a figure that underlines the scale of circulation and suggests that the asset may be attracting institutional attention. However, daily trading volume was noted at 6.92% below the monthly average, according to Diariobitcoin, which points to a possible decline in trading activity and could signal more vulnerability to volatility. These factors together contribute to a less robust environment for price stability in the near term.
Bearish momentum intensifies as oversold conditions and key resistance align
JUP is currently trading below the MA-20 at $0.3426 and the MA-50 at $0.3437 on the hourly chart, with ongoing short- and medium-term selling pressure evident. On the daily timeframe, price holds above the MA-200 at $0.2066, providing longer-term support, while the Ichimoku Kijun on the daily chart at $0.3424 forms a key resistance zone. Technical momentum is negative, as indicated by an RSI reading of 34.12 and both MACD and ADX showing a sell setup. Stochastic RSI and CCI are in oversold territory, suggesting the recent drop may be temporarily overextended. Bull/Bear Power confirms seller dominance intraday, while the Awesome Oscillator is neutral, and no significant divergences are present among momentum indicators.
Downside likely as consolidation depends on resistance breakout
Over the next two to three trading days, JUP is expected to consolidate within a volatility band between $0.3137 and $0.3387. A further decline is highly probable unless price rebounds above the immediate resistance zone of $0.3424–$0.3437. Downside momentum would be confirmed on a move below $0.3137, while any bullish scenario would require a breakout above the resistance area to signal a shift in sentiment.
Earlier, analysts noted that Jupiter’s price action was characterized by strong short-term momentum but mixed technical signals, warranting close monitoring for breakout or correction. The latest shift in technical momentum—now negative with increased selling pressure—marks a change in the near-term outlook, making a move below $0.3137 the primary risk to watch for further downside.






Latest Jupiter News




-
 Afghanistan
-
 Albania
-
 Algeria
-
 Angola
-
 Argentina
-
 Armenia
-
 Australia
-
 Austria
-
 Azerbaijan
-
 Bahamas
-
 Bahrain
-
 Bangladesh
-
 Belarus
-
 Belgium
-
 Bolivia
-
 Botswana
-
 Brazil
-
 Brunei
-
 Bulgaria
-
 Cambodia
-
 Cameroon
-
 Canada
-
 Chile
-
 China
-
 Colombia
-
 Congo
-
 Costa Rica
-
 Cote d'Ivoire
-
 Croatia
-
 Cuba
-
 Cyprus
-
 Czechia
-
 DR Congo
-
 Denmark
-
 Dominican Republic
-
 Ecuador
-
 Egypt
-
 El Salvador
-
 Estonia
-
 Eswatini
-
 Ethiopia
-
 Finland
-
 France
-
 Georgia
-
 Germany
-
 Ghana
-
 Greece
-
 Haiti
-
 Hong Kong
-
 Hungary
-
 India
-
 Indonesia
-
 Iran, Islamic republic
-
 Iraq
-
 Ireland
-
 Israel
-
 Italy
-
 Jamaica
-
 Japan
-
 Jordan
-
 Kazakhstan
-
 Kenya
-
 Korea
-
 Kuwait
-
 Kyrgyzstan
-
 Laos
-
 Latvia
-
 Lebanon
-
 Lesotho
-
 Libya
-
 Lithuania
-
 Luxembourg
-
 Madagascar
-
 Malaysia
-
 Malta
-
 Mauritius
-
 Mexico
-
 Moldova
-
 Mongolia
-
 Montenegro
-
 Morocco
-
 Mozambique
-
 Myanmar
-
 Namibia
-
 Nepal
-
 Netherlands
-
 New Zealand
-
 Nigeria
-
 North Macedonia
-
 Norway
-
 Oman
-
 Pakistan
-
 Palestine
-
 Panama
-
 Papua New Guinea
-
 Paraguay
-
 Peru
-
 Philippines
-
 Poland
-
 Portugal
-
 Puerto Rico
-
 Qatar
-
 Reunion
-
 Romania
-
 Rwanda
-
 Saudi Arabia
-
 Serbia
-
 Singapore
-
 Slovakia
-
 Slovenia
-
 Somalia
-
 South Africa
-
 Spain
-
 Sri Lanka
-
 Sweden
-
 Switzerland
-
 Syria
-
 Taiwan
-
 Tajikistan
-
 Tanzania
-
 Thailand
-
 Trinidad and Tobago
-
 Tunisia
-
 Turkey
-
 UAE
-
 Uganda
-
 Ukraine
-
 United Kingdom
-
United States
-
 Uruguay
-
 Uzbekistan
-
 Venezuela
-
 Vietnam
-
 Yemen
-
 Zambia
-
 Zimbabwe
- Forex
- Crypto












