

Why is THORChain down today? Sellers dominate with $0.693 support in focus

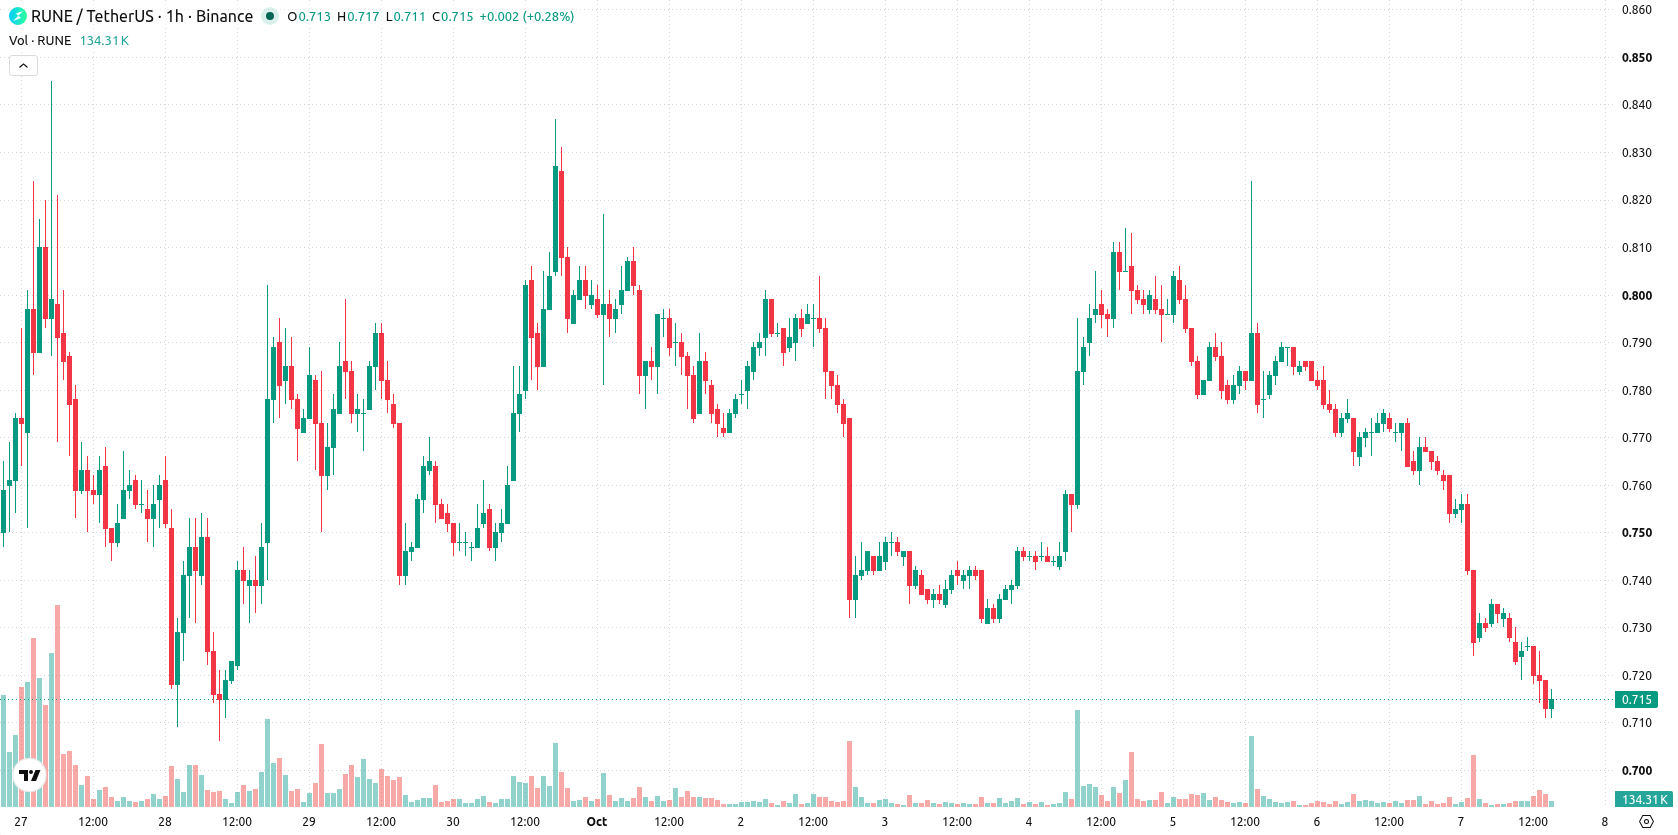
THORChain (RUNE) is trading at $0.716, down 6.65% for the day, and remains below its key moving averages.
 0.555
0.7330
Highlights
- THORChain processed $2.40 billion in swap volume and $3.01 million in System Income in September, indicating sustained use of the protocol.
- The validator set grew from 87 to 103, and 946,450 RUNE moved into Protocol-Owned Liquidity as the protocol changed internal income allocation after a v3.20 upgrade.
- RUNE trades below key short- and medium-term averages with technical signals showing strong seller pressure and a projected range of $0.693 to $0.739 in the next 2 to 3 days.
Protocol usage grows as internal liquidity allocation shifts
THORChain recorded $2.40 billion in swap volume and $3.01 million in System Income during September, with the majority of volume arriving in a concentrated period late in the month, according to Crypto Economy. These figures underscore robust underlying transactional activity and point to sustained protocol usage. Alongside this, the validator set expanded from 87 to 103, and 946,450 RUNE was moved into Protocol-Owned Liquidity with a revised protocol policy now allocating more System Income directly to internal liquidity rather than token burns following the v3.20 upgrade. Although these developments may strengthen protocol infrastructure and trading depth, price action has remained under broader selling pressure.
Mixed technical signals as price faces resistance below short-term averages
Short-term technical levels show RUNE/USD trading below the MA-20 ($0.7373) and MA-50 ($0.7607) on the H1 chart, while still positioned above the long-term MA-200 ($0.4656). Immediate resistance is defined by the Ichimoku Kijun at $0.744. Key support is established at $0.693. Among momentum indicators, MACD and ADX remain in sell territory. RSI and CCI readings are firmly oversold, whereas Stoch RSI presents a divergent buy signal. Bull/Bear Power reflects dominant seller activity in the intraday action, while the Awesome Oscillator is neutral and does not confirm the prevailing trend. The overall technical backdrop is characterized by heightened volatility and mixed signals among oscillators.
Downside favored as consolidation forms within volatile trading band
Over the next 2–3 trading days, RUNE/USD is likely to consolidate within a volatility band of $0.693–$0.739. Probability favors continued downside, with a bullish reversal seen as unlikely unless the price can decisively break above immediate resistance at $0.744. If bears push the price below $0.693 support, additional selling pressure could intensify and expose further downside risk. The baseline scenario anticipates sideways trading within the established range, with caution warranted for both breakout attempts and increased volatility.
Earlier, analysts noted that THORChain was exhibiting persistent bullish momentum, with technical indicators supporting the uptrend. The current article signals a shift in short-term dynamics as downside risk has increased, making the $0.693 support a critical level for traders to monitor for potential breaks or reversals.






Latest THORChain News




-
 Afghanistan
-
 Albania
-
 Algeria
-
 Angola
-
 Argentina
-
 Armenia
-
 Australia
-
 Austria
-
 Azerbaijan
-
 Bahamas
-
 Bahrain
-
 Bangladesh
-
 Belarus
-
 Belgium
-
 Bolivia
-
 Botswana
-
 Brazil
-
 Brunei
-
 Bulgaria
-
 Cambodia
-
 Cameroon
-
 Canada
-
 Chile
-
 China
-
 Colombia
-
 Congo
-
 Costa Rica
-
 Cote d'Ivoire
-
 Croatia
-
 Cuba
-
 Cyprus
-
 Czechia
-
 DR Congo
-
 Denmark
-
 Dominican Republic
-
 Ecuador
-
 Egypt
-
 El Salvador
-
 Estonia
-
 Eswatini
-
 Ethiopia
-
 Finland
-
 France
-
 Georgia
-
 Germany
-
 Ghana
-
 Greece
-
 Haiti
-
 Hong Kong
-
 Hungary
-
 India
-
 Indonesia
-
 Iran, Islamic republic
-
 Iraq
-
 Ireland
-
 Israel
-
 Italy
-
 Jamaica
-
 Japan
-
 Jordan
-
 Kazakhstan
-
 Kenya
-
 Korea
-
 Kuwait
-
 Kyrgyzstan
-
 Laos
-
 Latvia
-
 Lebanon
-
 Lesotho
-
 Libya
-
 Lithuania
-
 Luxembourg
-
 Madagascar
-
 Malaysia
-
 Malta
-
 Mauritius
-
 Mexico
-
 Moldova
-
 Mongolia
-
 Montenegro
-
 Morocco
-
 Mozambique
-
 Myanmar
-
 Namibia
-
 Nepal
-
 Netherlands
-
 New Zealand
-
 Nigeria
-
 North Macedonia
-
 Norway
-
 Oman
-
 Pakistan
-
 Palestine
-
 Panama
-
 Papua New Guinea
-
 Paraguay
-
 Peru
-
 Philippines
-
 Poland
-
 Portugal
-
 Puerto Rico
-
 Qatar
-
 Reunion
-
 Romania
-
 Rwanda
-
 Saudi Arabia
-
 Serbia
-
 Singapore
-
 Slovakia
-
 Slovenia
-
 Somalia
-
 South Africa
-
 Spain
-
 Sri Lanka
-
 Sweden
-
 Switzerland
-
 Syria
-
 Taiwan
-
 Tajikistan
-
 Tanzania
-
 Thailand
-
 Trinidad and Tobago
-
 Tunisia
-
 Turkey
-
 UAE
-
 Uganda
-
 Ukraine
-
 United Kingdom
-
United States
-
 Uruguay
-
 Uzbekistan
-
 Venezuela
-
 Vietnam
-
 Yemen
-
 Zambia
-
 Zimbabwe
- Forex
- Crypto












