

Arbitrum price outlook: Rally builds momentum after Paxos USDG launches on network

Arbitrum (ARB) is trading at $0.1821 after climbing 9.11% on the day, marking a strong upward move. The asset is now positioned above its key moving averages, reflecting renewed short-term buying momentum.
 0.1143
0.1374
Highlights
- Arbitrum has integrated Paxos Global Dollar (USDG) natively, expanding dollar-based stablecoin utility across its ecosystem.
- Morpho integration enables new vault-based yield strategies for USDG holders, incentivizing liquidity inflows and reinforcing network activity.
- ARB/USD trades at $0.1821, up 9.11% on the day, with mixed intraday signals and a projected range of $0.1711 to $0.1931 for the next 1 to 2 days.
Network utility expands and liquidity incentives drive platform usage
Arbitrum has launched Paxos’ Global Dollar (USDG) natively on its network, integrating the platform with the Global Dollar Network and introducing a new dollar-based stablecoin, according to Paragraph. This strategic move directly expands utility and dollar-denominated flows within the Arbitrum ecosystem, fueling demand for network activity. Additionally, Arbitrum teams have created a vault-based earning opportunity through Morpho integration, giving USDG holders access to new yield strategies and incentivizing liquidity inflow, as reported by Coinfomania. Together, these initiatives reinforce overall platform usage and support the current upward momentum in ARB.
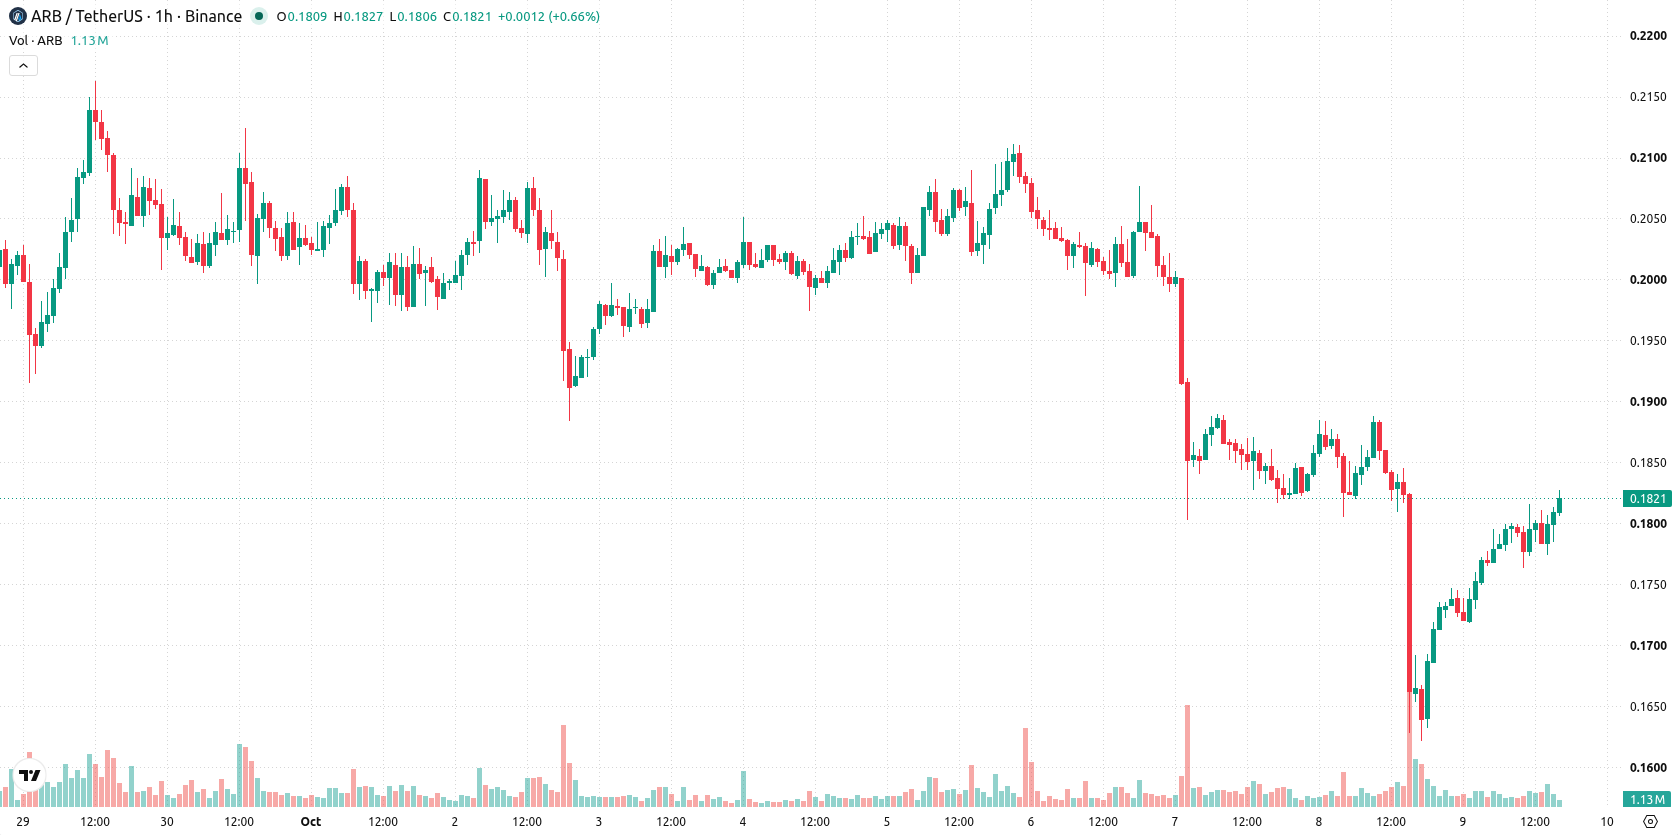
Conflicting momentum signals as price tests upper technical boundaries
On the H1 chart, ARB/USD has surged above both the MA-20 at $0.1769 and the MA-50 at $0.1797, while on the daily timeframe the price holds well above the MA-200 at $0.1133. The Ichimoku Kijun, now at $0.1733, serves as immediate support. Momentum indicators present a mixed picture intraday: RSI suggests a buy setup, CCI points to continued buyer pressure, and Bull/Bear Power also places buyers in control. Meanwhile, Stoch RSI signals strong selling pressure, ADX shows waning trend strength, and MACD remains neutral. The Awesome Oscillator supports the prevailing upward tone, but the blend of conflicting indicators calls for caution regarding potential reversals.
Price outlook balanced as volatility band constrains breakout risks
Over the coming 1–2 trading days, ARB/USD is expected to trade within a typical volatility band between $0.1711 and $0.1931. The probability of upward continuation is estimated at 57%, with the chance of a move lower at 43%. Baseline expectations point to price consolidating within this range, while a break above the resistance could trigger further gains and a drop below immediate support may lead to corrective movement.
Earlier, analysts noted that Arbitrum was exhibiting downside risk due to persistent selling pressure and mixed technical signals despite network developments. The current analysis highlights a shift in near-term momentum, with indicators warranting close monitoring of price reactions around major moving averages for signs of sustained trend reversal or renewed volatility.










-
 Afghanistan
-
 Albania
-
 Algeria
-
 Angola
-
 Argentina
-
 Armenia
-
 Australia
-
 Austria
-
 Azerbaijan
-
 Bahamas
-
 Bahrain
-
 Bangladesh
-
 Belarus
-
 Belgium
-
 Bolivia
-
 Botswana
-
 Brazil
-
 Brunei
-
 Bulgaria
-
 Cambodia
-
 Cameroon
-
 Canada
-
 Chile
-
 China
-
 Colombia
-
 Congo
-
 Costa Rica
-
 Cote d'Ivoire
-
 Croatia
-
 Cuba
-
 Cyprus
-
 Czechia
-
 DR Congo
-
 Denmark
-
 Dominican Republic
-
 Ecuador
-
 Egypt
-
 El Salvador
-
 Estonia
-
 Eswatini
-
 Ethiopia
-
 Finland
-
 France
-
 Georgia
-
 Germany
-
 Ghana
-
 Greece
-
 Haiti
-
 Hong Kong
-
 Hungary
-
 India
-
 Indonesia
-
 Iran, Islamic republic
-
 Iraq
-
 Ireland
-
 Israel
-
 Italy
-
 Jamaica
-
 Japan
-
 Jordan
-
 Kazakhstan
-
 Kenya
-
 Korea
-
 Kuwait
-
 Kyrgyzstan
-
 Laos
-
 Latvia
-
 Lebanon
-
 Lesotho
-
 Libya
-
 Lithuania
-
 Luxembourg
-
 Madagascar
-
 Malaysia
-
 Malta
-
 Mauritius
-
 Mexico
-
 Moldova
-
 Mongolia
-
 Montenegro
-
 Morocco
-
 Mozambique
-
 Myanmar
-
 Namibia
-
 Nepal
-
 Netherlands
-
 New Zealand
-
 Nigeria
-
 North Macedonia
-
 Norway
-
 Oman
-
 Pakistan
-
 Palestine
-
 Panama
-
 Papua New Guinea
-
 Paraguay
-
 Peru
-
 Philippines
-
 Poland
-
 Portugal
-
 Puerto Rico
-
 Qatar
-
 Reunion
-
 Romania
-
 Rwanda
-
 Saudi Arabia
-
 Serbia
-
 Singapore
-
 Slovakia
-
 Slovenia
-
 Somalia
-
 South Africa
-
 Spain
-
 Sri Lanka
-
 Sweden
-
 Switzerland
-
 Syria
-
 Taiwan
-
 Tajikistan
-
 Tanzania
-
 Thailand
-
 Trinidad and Tobago
-
 Tunisia
-
 Turkey
-
 UAE
-
 Uganda
-
 Ukraine
-
 United Kingdom
-
United States
-
 Uruguay
-
 Uzbekistan
-
 Venezuela
-
 Vietnam
-
 Yemen
-
 Zambia
-
 Zimbabwe
- Forex
- Crypto












