

Will Arbitrum break resistance as buying momentum builds?

Arbitrum (ARB) is trading at $0.1977, marking a 7.04% increase for the day. The asset sits above its key moving averages, reflecting intraday bullish momentum.
 0.1567
0.1786
Highlights
- Short liquidations totaling $250,000 forced buying activity in Arbitrum, fueling accelerated price momentum on major exchanges.
- The liquidity shift from these liquidations is driving pronounced upward movement, with traders covering positions to prevent further losses.
- ARB/USD surged 7.04% to $0.1977 with strong bullish momentum and is projected to trade between $0.1867 and $0.2087 over the next 2 to 3 days.
Forced buying intensifies as short liquidations drive rally
A surge in short liquidations totaling $250,000 across major exchanges, as reported by Tokenpost, has acted as a powerful catalyst for forced buying in Arbitrum. This liquidation activity compels traders to cover positions, amplifying upward price momentum through accelerated market buy orders. The resulting liquidity shift underpins the pronounced upward movement currently observed in the asset.
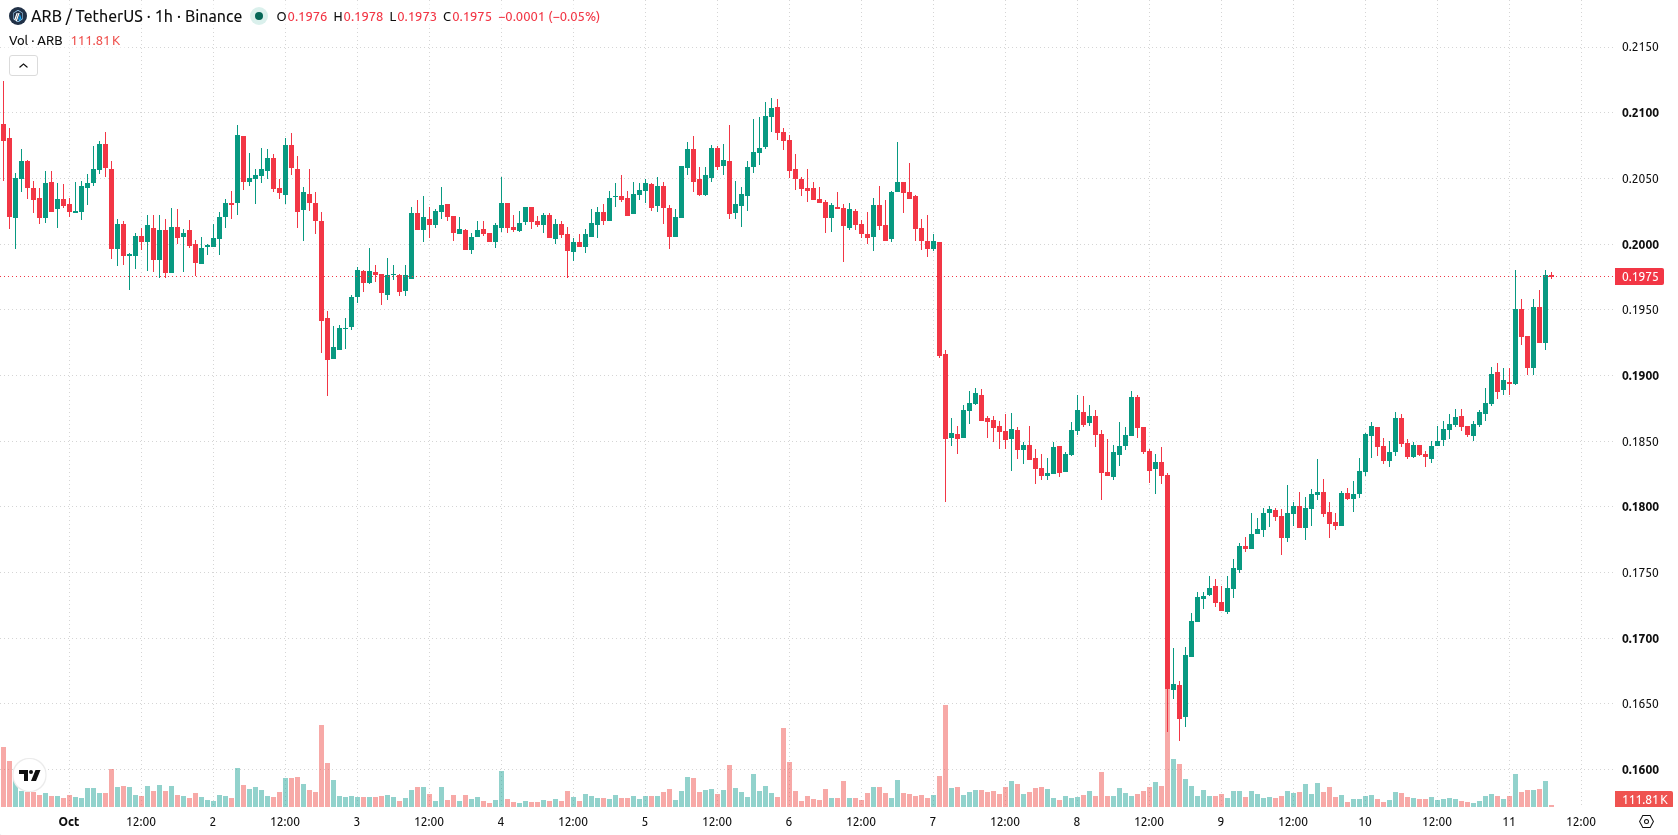
Sustained trend strength as technicals approach overbought zones
On the H1 timeframe, ARB trades above its MA-20 at $0.1886 and MA-50 at $0.1842, while the daily chart shows the price firmly above the MA-200 at $0.1142. The Ichimoku Kijun provides immediate support at $0.1905. Momentum indicators reveal a bullish stance, with both MACD and ADX confirming a strong trend. RSI is at 66.96, reflecting a buy bias while nearing overbought territory; CCI indicates overbought conditions, and Stochastic RSI remains neutral, signifying mixed short-term signals. Bull/Bear Power shows notable buyer dominance on the intraday chart, and the Awesome Oscillator aligns with current upward momentum.
Breakout risk increases as volatility band shapes outlook
Over the next 2–3 trading days, ARB is expected to move within a volatility band of $0.1867 to $0.2087. The dominant scenario points to sideways consolidation between these bounds. However, should a breakout above $0.2087 occur, this may trigger further upside momentum; conversely, a break below $0.1867 would suggest a shift toward corrective action, though this is currently assessed as unlikely.
Earlier, analysts noted that Layer 2 networks like Arbitrum are increasingly seeing capital and user concentration as the market shifts away from supporting less competitive platforms. With ARB showing sustained bullish momentum and a strong technical posture, traders should closely monitor the $0.2087 resistance level for signs of a potential breakout and further upside movement.











-
 Afghanistan
-
 Albania
-
 Algeria
-
 Angola
-
 Argentina
-
 Armenia
-
 Australia
-
 Austria
-
 Azerbaijan
-
 Bahamas
-
 Bahrain
-
 Bangladesh
-
 Belarus
-
 Belgium
-
 Bolivia
-
 Botswana
-
 Brazil
-
 Brunei
-
 Bulgaria
-
 Cambodia
-
 Cameroon
-
 Canada
-
 Chile
-
 China
-
 Colombia
-
 Congo
-
 Costa Rica
-
 Cote d'Ivoire
-
 Croatia
-
 Cuba
-
 Cyprus
-
 Czechia
-
 DR Congo
-
 Denmark
-
 Dominican Republic
-
 Ecuador
-
 Egypt
-
 El Salvador
-
 Estonia
-
 Eswatini
-
 Ethiopia
-
 Finland
-
 France
-
 Georgia
-
 Germany
-
 Ghana
-
 Greece
-
 Haiti
-
 Hong Kong
-
 Hungary
-
 India
-
 Indonesia
-
 Iran, Islamic republic
-
 Iraq
-
 Ireland
-
 Israel
-
 Italy
-
 Jamaica
-
 Japan
-
 Jordan
-
 Kazakhstan
-
 Kenya
-
 Korea
-
 Kuwait
-
 Kyrgyzstan
-
 Laos
-
 Latvia
-
 Lebanon
-
 Lesotho
-
 Libya
-
 Lithuania
-
 Luxembourg
-
 Madagascar
-
 Malaysia
-
 Malta
-
 Mauritius
-
 Mexico
-
 Moldova
-
 Mongolia
-
 Montenegro
-
 Morocco
-
 Mozambique
-
 Myanmar
-
 Namibia
-
 Nepal
-
 Netherlands
-
 New Zealand
-
 Nigeria
-
 North Macedonia
-
 Norway
-
 Oman
-
 Pakistan
-
 Palestine
-
 Panama
-
 Papua New Guinea
-
 Paraguay
-
 Peru
-
 Philippines
-
 Poland
-
 Portugal
-
 Puerto Rico
-
 Qatar
-
 Reunion
-
 Romania
-
 Rwanda
-
 Saudi Arabia
-
 Serbia
-
 Singapore
-
 Slovakia
-
 Slovenia
-
 Somalia
-
 South Africa
-
 Spain
-
 Sri Lanka
-
 Sweden
-
 Switzerland
-
 Syria
-
 Taiwan
-
 Tajikistan
-
 Tanzania
-
 Thailand
-
 Trinidad and Tobago
-
 Tunisia
-
 Turkey
-
 UAE
-
 Uganda
-
 Ukraine
-
 United Kingdom
-
United States
-
 Uruguay
-
 Uzbekistan
-
 Venezuela
-
 Vietnam
-
 Yemen
-
 Zambia
-
 Zimbabwe
- Forex
- Crypto












