


Jupiter (JUP) slid 11.44% following heavy selling, even as recent buybacks and a substantial supply of staked tokens reduced available float. The decline contradicts intact bullish momentum signals, with the price holding above all major moving averages and near-term support levels.
 0.3709
0.3881
0.3709
0.3881
Highlights
- Roughly one third of Jupiter tokens remain staked and off the market, constraining circulating supply and liquidity.
- The buyback program has acquired $44 million in tokens since February 17, 2025, including $5.59 million in the third quarter of 2026.
- JUP/USD maintains bullish momentum above key supports, with the next five-day range expected at $0.2997 to $0.386 and over 80% probability of an upward move.
Staked supply and buybacks limit float but fail to stem selling
Approximately one third of Jupiter tokens are currently staked, making them unavailable for trading and affecting liquidity. Since February 17, 2025, a buyback program funded by product revenues has repurchased around $44 million in tokens, with $5.59 million spent in the third quarter of 2026. These developments have influenced JUP's effective circulating supply, though price action has remained under broader selling pressure.
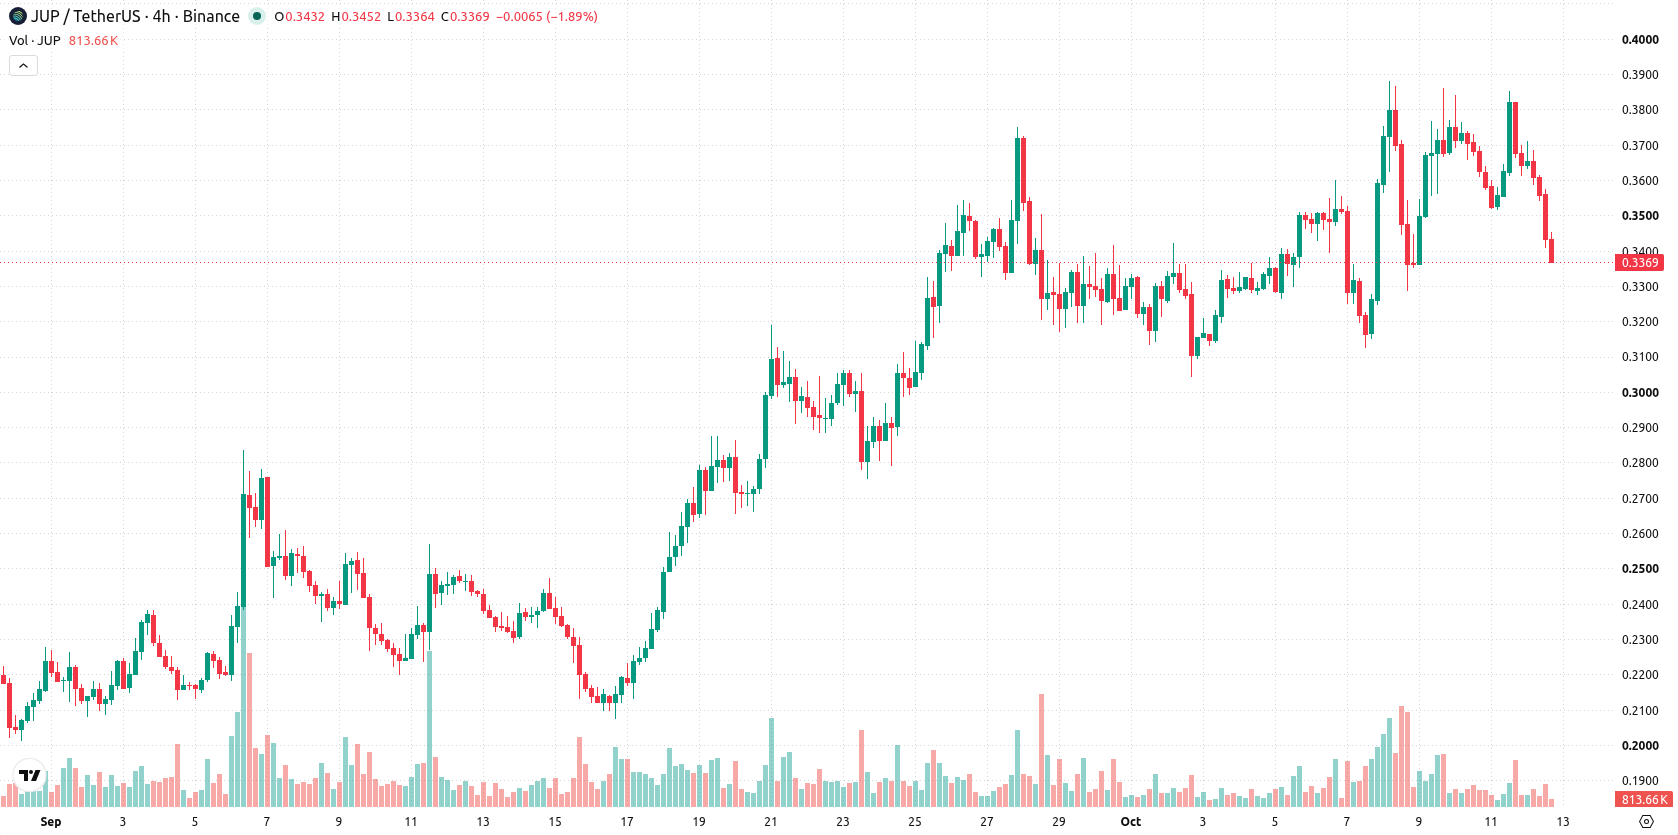
Strong bullish momentum sustains above support as volatility rises
JUP/USD trades above the 20-day ($0.3368), 50-day ($0.2762), and 200-day ($0.2117) moving averages, indicating strong bullish momentum across all major time frames. A bullish alignment remains between the 50-day and 200-day averages. The immediate support level is at $0.3368, while resistance is at $0.3522. Momentum indicators, including MACD and ADX, issue buy signals. RSI at 62.6318 stays constructive, while Stochastic RSI and CCI readings suggest overbought conditions, increasing appreciation risk. Bull/Bear Power is positive at 0.0401 and the Awesome Oscillator also signals active buying. The pair is currently down $0.0436 with continued intraday volatility at 5.31%, and a downside gap continues to pressure the near-term tone.
Earlier, analysts noted that Jupiter's tightening supply and deepening ecosystem activity were being overshadowed by lingering downside risks and range-bound trading conditions. The current analysis adds a new dimension by highlighting a shift toward broad-based bullish momentum, with strong buy signals across multiple indicators and a pivotal focus on the $0.3522 resistance as the next key level to watch for continued upside.










-
 Afghanistan
-
 Albania
-
 Algeria
-
 Angola
-
 Argentina
-
 Armenia
-
 Australia
-
 Austria
-
 Azerbaijan
-
 Bahamas
-
 Bahrain
-
 Bangladesh
-
 Belarus
-
 Belgium
-
 Bolivia
-
 Botswana
-
 Brazil
-
 Brunei
-
 Bulgaria
-
 Cambodia
-
 Cameroon
-
 Canada
-
 Chile
Chile
-
 China
China
-
 Colombia
-
 Congo
Congo
-
 Costa Rica
-
 Cote d'Ivoire
-
 Croatia
-
 Cuba
Cuba
-
 Cyprus
-
 Czechia
-
 DR Congo
-
 Denmark
-
 Dominican Republic
-
 Ecuador
-
 Egypt
Egypt
-
 El Salvador
-
 Estonia
-
 Eswatini
-
 Ethiopia
-
 Finland
-
 France
-
 Georgia
-
 Germany
-
 Ghana
Ghana
-
 Greece
-
 Haiti
Haiti
-
 Hong Kong
-
 Hungary
-
 India
India
-
 Indonesia
-
 Iran, Islamic republic
-
 Iraq
Iraq
-
 Ireland
-
 Israel
-
 Italy
Italy
-
 Jamaica
-
 Japan
Japan
-
 Jordan
-
 Kazakhstan
-
 Kenya
Kenya
-
 Korea
Korea
-
 Kuwait
-
 Kyrgyzstan
-
 Laos
Laos
-
 Latvia
-
 Lebanon
-
 Lesotho
-
 Libya
Libya
-
 Lithuania
-
 Luxembourg
-
 Madagascar
-
 Malaysia
-
 Malta
Malta
-
 Mauritius
-
 Mexico
-
 Moldova
-
 Mongolia
-
 Montenegro
-
 Morocco
-
 Mozambique
-
 Myanmar
-
 Namibia
-
 Nepal
Nepal
-
 Netherlands
-
 New Zealand
-
 Nigeria
-
 North Macedonia
-
 Norway
-
 Oman
Oman
-
 Pakistan
-
 Palestine
-
 Panama
-
 Papua New Guinea
-
 Paraguay
-
 Peru
Peru
-
 Philippines
-
 Poland
-
 Portugal
-
 Puerto Rico
-
 Qatar
Qatar
-
 Reunion
-
 Romania
-
 Rwanda
-
 Saudi Arabia
-
 Serbia
-
 Singapore
-
 Slovakia
-
 Slovenia
-
 Somalia
-
 South Africa
-
 Spain
Spain
-
 Sri Lanka
-
 Sweden
-
 Switzerland
-
 Syria
Syria
-
 Taiwan
-
 Tajikistan
-
 Tanzania
-
 Thailand
-
 Trinidad and Tobago
-
 Tunisia
-
 Turkey
-
 UAE
UAE
-
 Uganda
-
 Ukraine
-
 United Kingdom
-
United States
-
 Uruguay
-
 Uzbekistan
-
 Venezuela
-
 Vietnam
-
 Yemen
Yemen
-
 Zambia
-
 Zimbabwe
- Forex
- Crypto












