

XTZ slides as downward price move gains momentum amid strong seller pressure

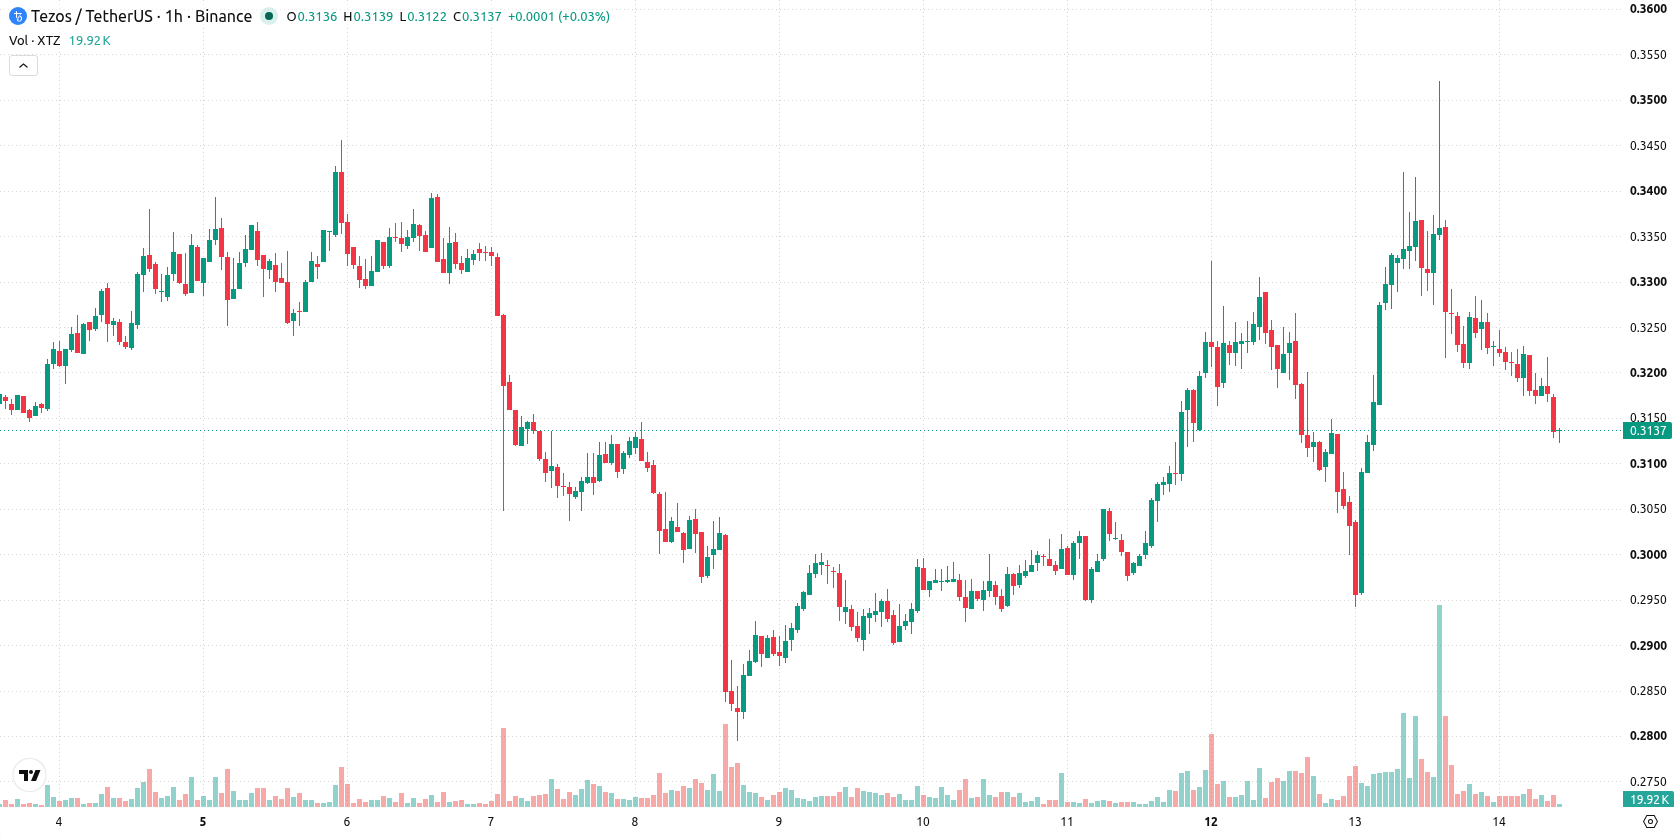
Tezos (XTZ) is trading at $0.313, down 7.91% on the day. The asset is positioned below its key short and medium-term moving averages, indicating pressure from sellers in the current session.
 0.2182
0.25470000
Highlights
- XTZ/USD remains under short- and medium-term selling pressure, trading below key averages on the hourly chart.
- Momentum indicators show consistent bearish bias with oversold readings and continued seller dominance across the session.
- XTZ/USD is expected to trade between $0.2902 and $0.32925621 over 2 to 3 days, with a 76% probability of a bearish move.
Bearish bias holds as oversold signals and key resistance converge
On the technical side, XTZ/USD remains below both the MA-20 and MA-50 on the H1 chart, while staying above the MA-200 when viewed on the daily timeframe. The Ichimoku Kijun at $0.3343 serves as immediate resistance. Momentum indicators reinforce the bearish bias, with RSI, CCI, and Stochastic RSI all signaling oversold conditions, MACD pointing to continued selling, and Bull/Bear Power showing sellers remain in control. The Awesome Oscillator continues to align with this downward move, while the ADX stays neutral.
Rangebound outlook prevails as resistance caps upside potential
XTZ/USD is forecast to remain within the $0.2902 to $0.32925621 corridor over the next 2–3 days. There is a 24% probability of an upward move, whereas the likelihood of further downside stands at 76%. The base scenario calls for rangebound action, with upside bias only emerging if price clears the immediate resistance at $0.3343, while renewed bearish momentum could develop below $0.2902.
Earlier, analysts noted that Tezos was demonstrating bullish momentum and positive technical signals above key moving averages. The current shift to bearish momentum and selling pressure marks a turnaround in trend, with traders now advised to monitor the $0.3343 resistance as a potential pivot point for any change in direction.














-
 Afghanistan
-
 Albania
-
 Algeria
-
 Angola
-
 Argentina
-
 Armenia
-
 Australia
-
 Austria
-
 Azerbaijan
-
 Bahamas
-
 Bahrain
-
 Bangladesh
-
 Belarus
-
 Belgium
-
 Bolivia
-
 Botswana
-
 Brazil
-
 Brunei
-
 Bulgaria
-
 Cambodia
-
 Cameroon
-
 Canada
-
 Chile
-
 China
-
 Colombia
-
 Congo
-
 Costa Rica
-
 Cote d'Ivoire
-
 Croatia
-
 Cuba
-
 Cyprus
-
 Czechia
-
 DR Congo
-
 Denmark
-
 Dominican Republic
-
 Ecuador
-
 Egypt
-
 El Salvador
-
 Estonia
-
 Eswatini
-
 Ethiopia
-
 Finland
-
 France
-
 Georgia
-
 Germany
-
 Ghana
-
 Greece
-
 Haiti
-
 Hong Kong
-
 Hungary
-
 India
-
 Indonesia
-
 Iran, Islamic republic
-
 Iraq
-
 Ireland
-
 Israel
-
 Italy
-
 Jamaica
-
 Japan
-
 Jordan
-
 Kazakhstan
-
 Kenya
-
 Korea
-
 Kuwait
-
 Kyrgyzstan
-
 Laos
-
 Latvia
-
 Lebanon
-
 Lesotho
-
 Libya
-
 Lithuania
-
 Luxembourg
-
 Madagascar
-
 Malaysia
-
 Malta
-
 Mauritius
-
 Mexico
-
 Moldova
-
 Mongolia
-
 Montenegro
-
 Morocco
-
 Mozambique
-
 Myanmar
-
 Namibia
-
 Nepal
-
 Netherlands
-
 New Zealand
-
 Nigeria
-
 North Macedonia
-
 Norway
-
 Oman
-
 Pakistan
-
 Palestine
-
 Panama
-
 Papua New Guinea
-
 Paraguay
-
 Peru
-
 Philippines
-
 Poland
-
 Portugal
-
 Puerto Rico
-
 Qatar
-
 Reunion
-
 Romania
-
 Rwanda
-
 Saudi Arabia
-
 Serbia
-
 Singapore
-
 Slovakia
-
 Slovenia
-
 Somalia
-
 South Africa
-
 Spain
-
 Sri Lanka
-
 Sweden
-
 Switzerland
-
 Syria
-
 Taiwan
-
 Tajikistan
-
 Tanzania
-
 Thailand
-
 Trinidad and Tobago
-
 Tunisia
-
 Turkey
-
 UAE
-
 Uganda
-
 Ukraine
-
 United Kingdom
-
United States
-
 Uruguay
-
 Uzbekistan
-
 Venezuela
-
 Vietnam
-
 Yemen
-
 Zambia
-
 Zimbabwe
- Forex
- Crypto












