


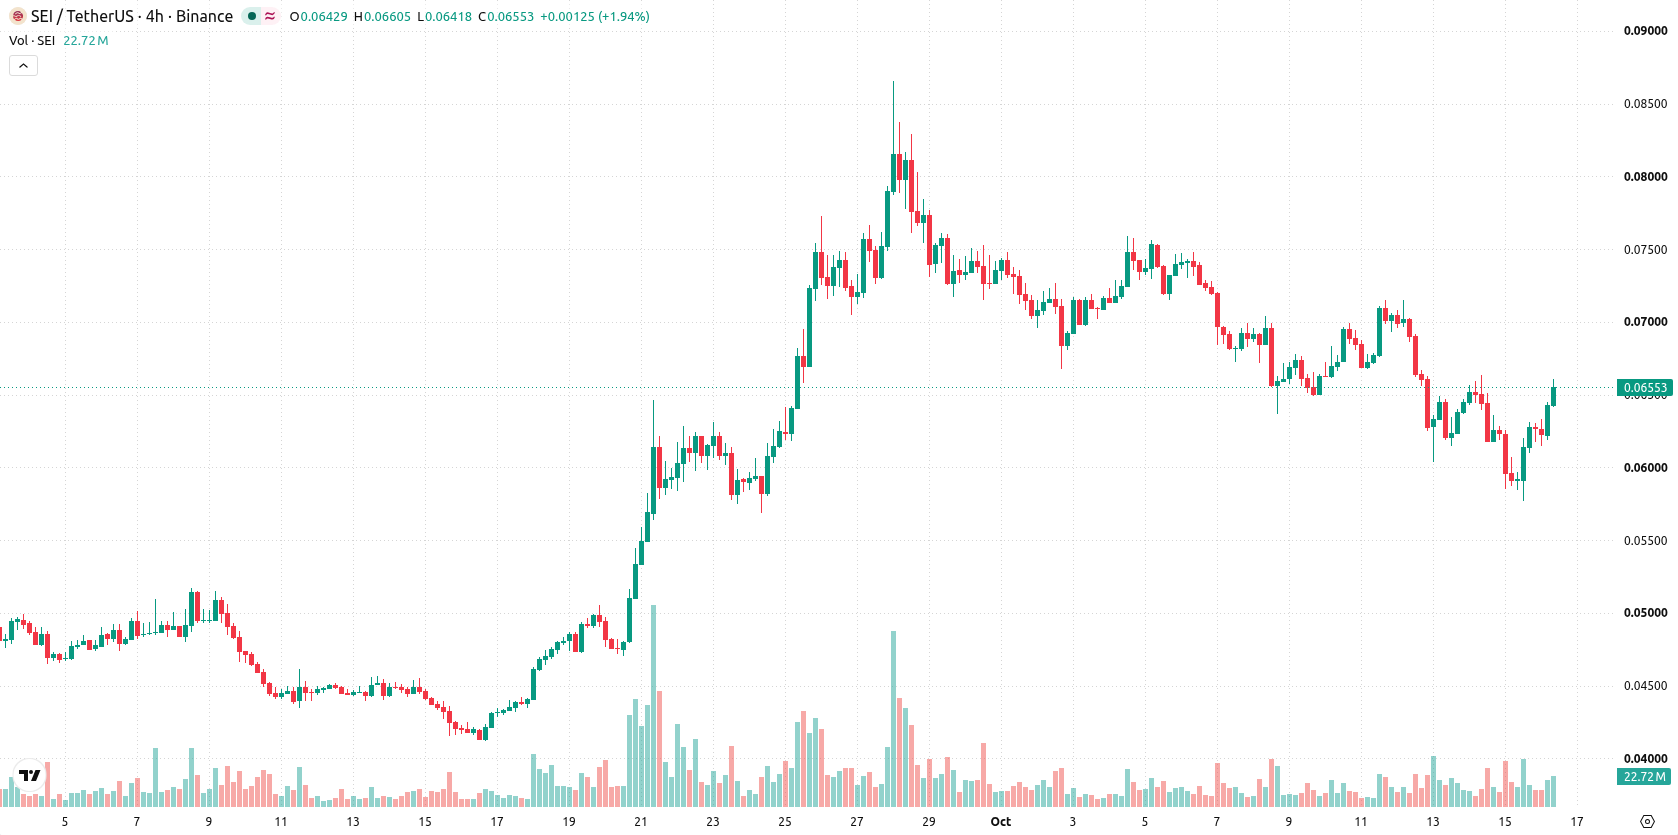
Sei (SEI) surged 10.98% in a strong intraday rally driven by robust technical momentum and an upside gap. The move shows underlying strength, but lingering short-term seller pressure and resistance below the 20-day moving average limit further gains.
 0.0653
0.0715
0.0653
0.0715
Highlights
- SEI/USD remains in a bullish medium- and long-term trend, despite near-term seller pressure and trading below its 20-day average.
- Momentum signals are mixed with oversold conditions indicated by several oscillators, but strong daily gains totaling 10.98% and an upside gap of 6.45%.
- SEI/USD is expected to trade in a $0.0585 to $0.0723 range over the next five days, with key levels at $0.0668 resistance and $0.0645 support.
Bullish long-term trend as near-term sellers test mixed momentum
SEI/USD trades below its 20-day moving average at $0.0699, while remaining above both the 50-day at $0.0576 and the 200-day at $0.0541. This setup indicates lingering short-term seller pressure, but the medium- and long-term trend structure remains bullish, with near-term resistance at $0.0668 and support at $0.0645. Momentum signals are mixed: the MACD points to strong buy, but the Average Directional Index (ADX) signals a sell. The Relative Strength Index (RSI) leans sell at 47.3 and both Stochastic RSI and Commodity Channel Index (CCI) indicate an oversold condition. Sellers have the upper hand in intraday momentum per the negative Bull/Bear Power (BBP), also reflecting oversold. SEI/USD is posting strong daily gains, up $0.0065 or 10.98%, following an upside gap of 6.45%. The pair is trading near the session high, with intraday volatility at 4.88%, showing strength toward highs. Divergence among oscillators and momentum readings suggests underlying uncertainty.
Earlier, analysts noted that Sei had shifted to a bullish technical momentum after overcoming previous weakness. The current analysis adds a layer of caution, highlighting mixed momentum indicators and suggesting that price action around the $0.0668 resistance will be critical for defining the next directional move.




Latest Sei News




-
 Afghanistan
-
 Albania
-
 Algeria
-
 Angola
-
 Argentina
-
 Armenia
-
 Australia
-
 Austria
-
 Azerbaijan
-
 Bahamas
-
 Bahrain
-
 Bangladesh
-
 Belarus
-
 Belgium
-
 Bolivia
-
 Botswana
-
 Brazil
-
 Brunei
-
 Bulgaria
-
 Cambodia
-
 Cameroon
-
 Canada
-
 Chile
Chile
-
 China
China
-
 Colombia
-
 Congo
Congo
-
 Costa Rica
-
 Cote d'Ivoire
-
 Croatia
-
 Cuba
Cuba
-
 Cyprus
-
 Czechia
-
 DR Congo
-
 Denmark
-
 Dominican Republic
-
 Ecuador
-
 Egypt
Egypt
-
 El Salvador
-
 Estonia
-
 Eswatini
-
 Ethiopia
-
 Finland
-
 France
-
 Georgia
-
 Germany
-
 Ghana
Ghana
-
 Greece
-
 Haiti
Haiti
-
 Hong Kong
-
 Hungary
-
 India
India
-
 Indonesia
-
 Iran, Islamic republic
-
 Iraq
Iraq
-
 Ireland
-
 Israel
-
 Italy
Italy
-
 Jamaica
-
 Japan
Japan
-
 Jordan
-
 Kazakhstan
-
 Kenya
Kenya
-
 Korea
Korea
-
 Kuwait
-
 Kyrgyzstan
-
 Laos
Laos
-
 Latvia
-
 Lebanon
-
 Lesotho
-
 Libya
Libya
-
 Lithuania
-
 Luxembourg
-
 Madagascar
-
 Malaysia
-
 Malta
Malta
-
 Mauritius
-
 Mexico
-
 Moldova
-
 Mongolia
-
 Montenegro
-
 Morocco
-
 Mozambique
-
 Myanmar
-
 Namibia
-
 Nepal
Nepal
-
 Netherlands
-
 New Zealand
-
 Nigeria
-
 North Macedonia
-
 Norway
-
 Oman
Oman
-
 Pakistan
-
 Palestine
-
 Panama
-
 Papua New Guinea
-
 Paraguay
-
 Peru
Peru
-
 Philippines
-
 Poland
-
 Portugal
-
 Puerto Rico
-
 Qatar
Qatar
-
 Reunion
-
 Romania
-
 Rwanda
-
 Saudi Arabia
-
 Serbia
-
 Singapore
-
 Slovakia
-
 Slovenia
-
 Somalia
-
 South Africa
-
 Spain
Spain
-
 Sri Lanka
-
 Sweden
-
 Switzerland
-
 Syria
Syria
-
 Taiwan
-
 Tajikistan
-
 Tanzania
-
 Thailand
-
 Trinidad and Tobago
-
 Tunisia
-
 Turkey
-
 UAE
UAE
-
 Uganda
-
 Ukraine
-
 United Kingdom
-
United States
-
 Uruguay
-
 Uzbekistan
-
 Venezuela
-
 Vietnam
-
 Yemen
Yemen
-
 Zambia
-
 Zimbabwe
- Forex
- Crypto












